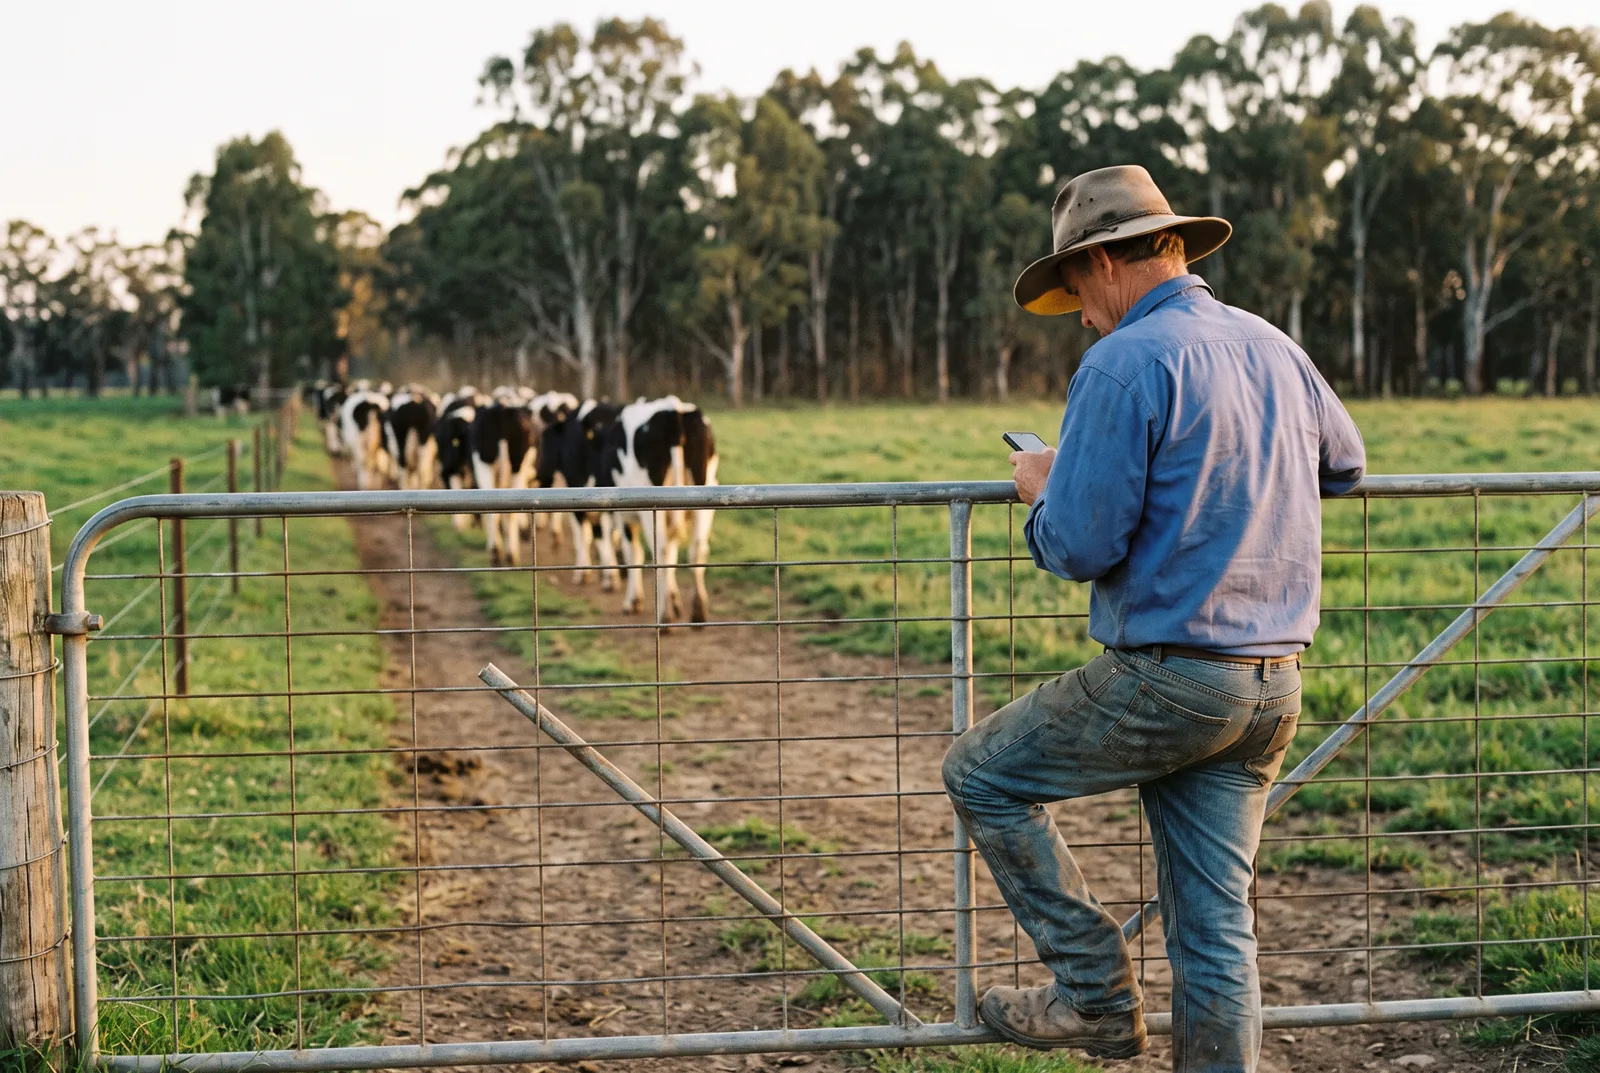
Faarm is a farm management platform that puts the whole property on one map: paddocks, herds, pasture, tasks and every sensor in the field. I designed the product from the first wireframes through to the brand.
faarm.com.au ↗- Client
- Faarm
- AgTech, Australia and New Zealand
- My role
- Product designer
- UX, UI and brand
- Scope
- Web app
- Desktop, iPad and phone
- Status
- Launching soon
- Co-design trial with farmers
The problem
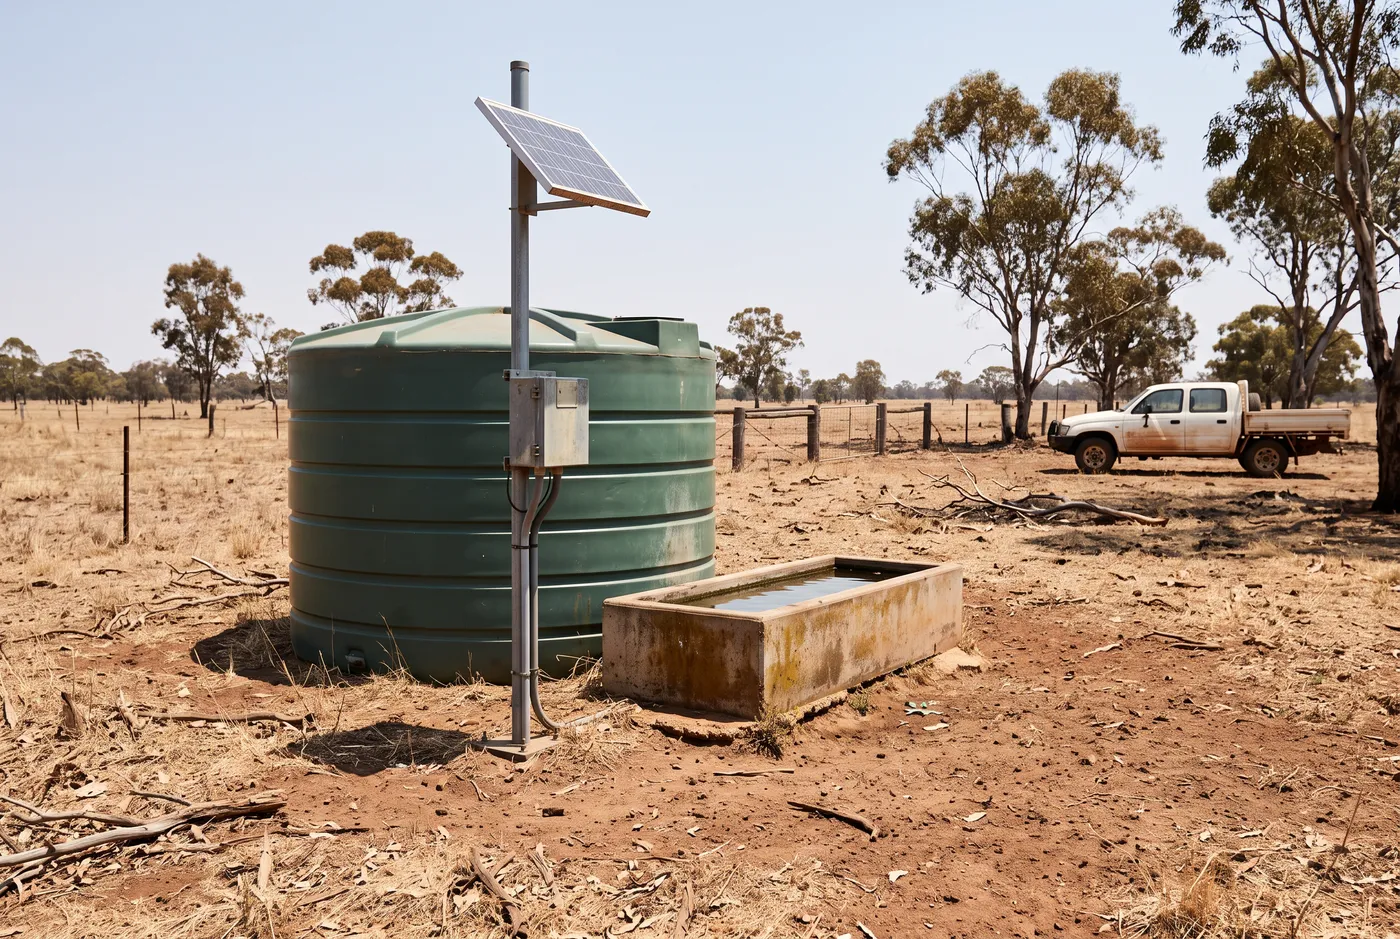
A modern farm runs on a patchwork. The water tank monitor, the weather station, the gate sensor and the tracker each come with their own app, and none of them talk to each other. The herd records are in a notebook or a spreadsheet.
So the farmer drives from paddock to paddock to check things a sensor already knows. Faarm's founders had spent years building monitoring systems for mining, and they saw the same gap in agriculture.
They wanted one platform that connects the hardware a farm already owns and shows everything in one view. My job was to work out what that view should be.
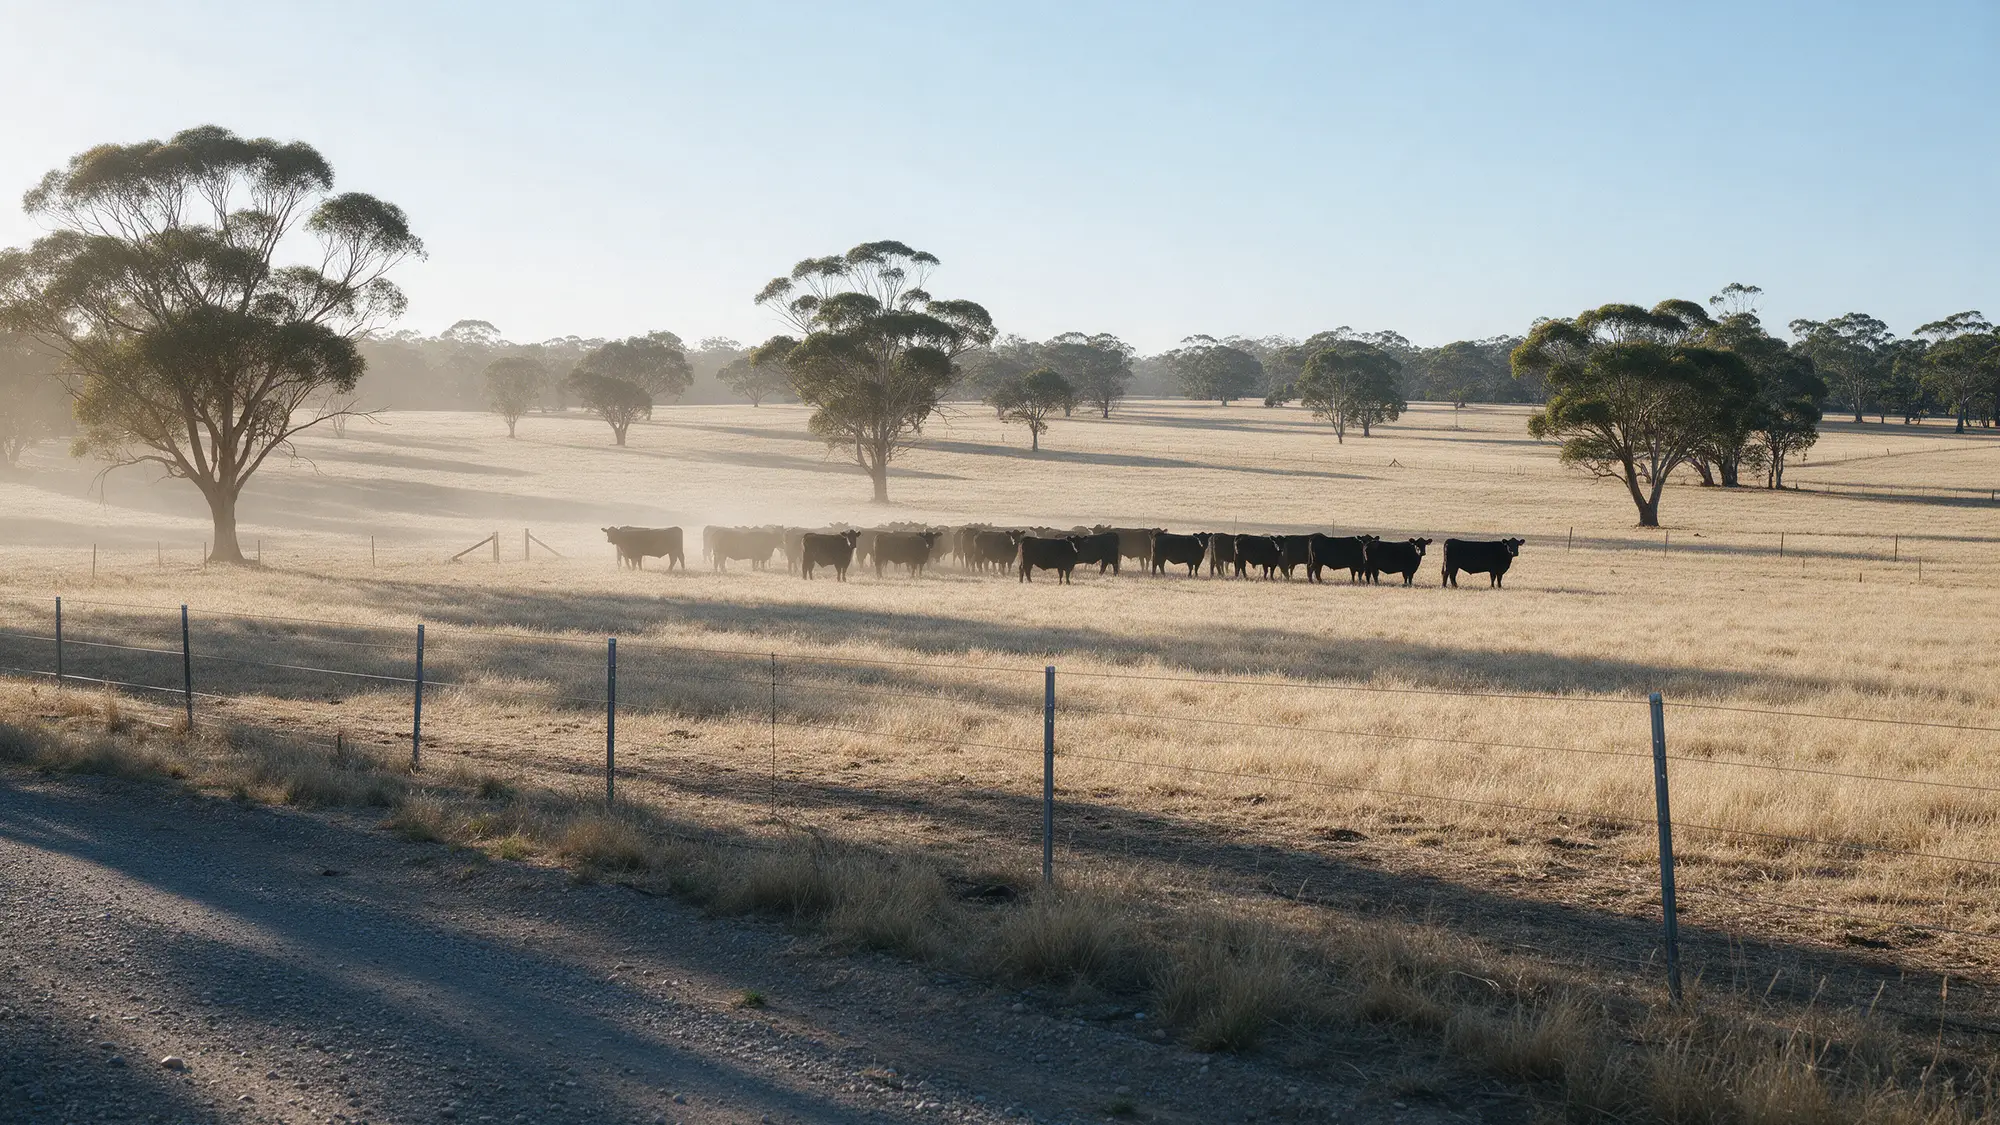
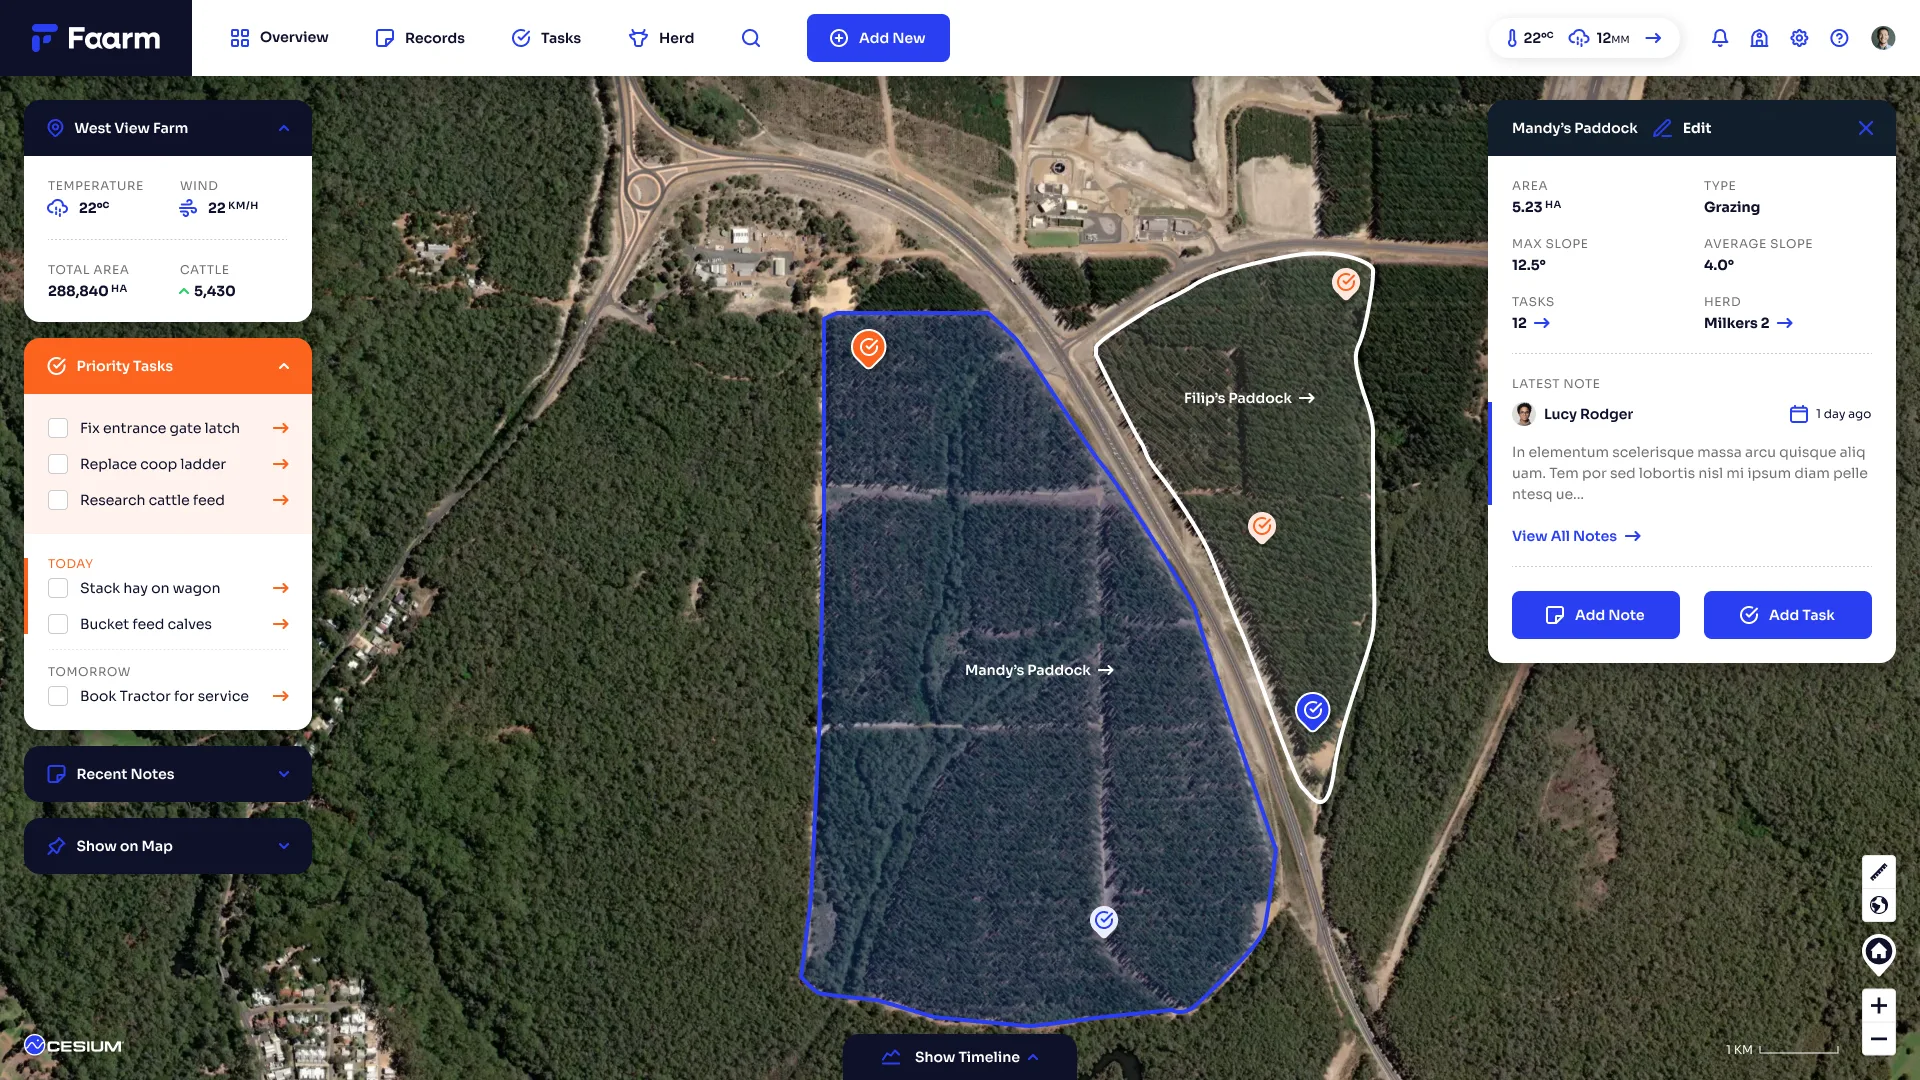
Farmers think in paddocks, so the product starts with the map.
What it covers
- 01
Map and paddocks
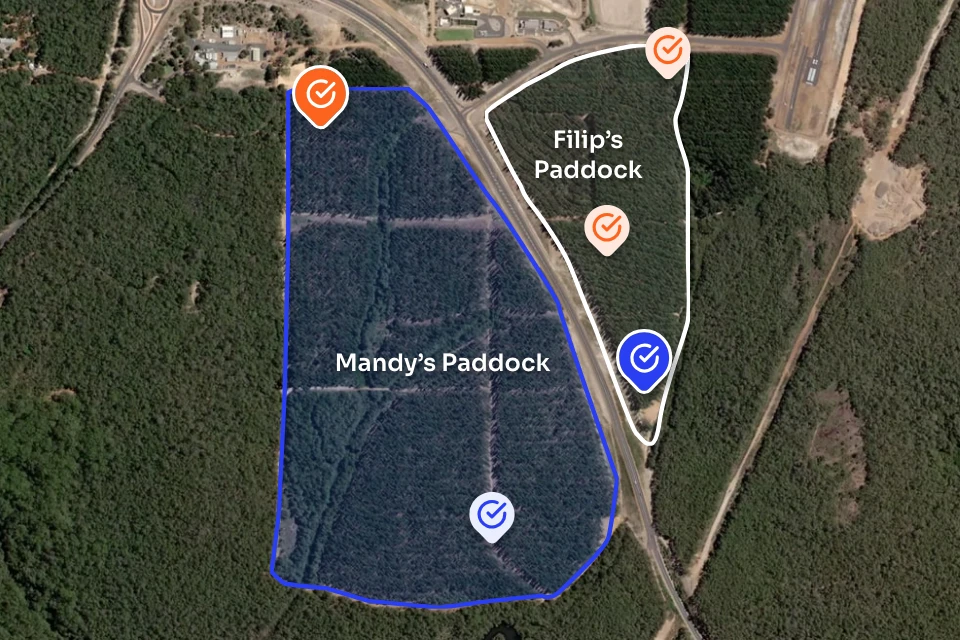
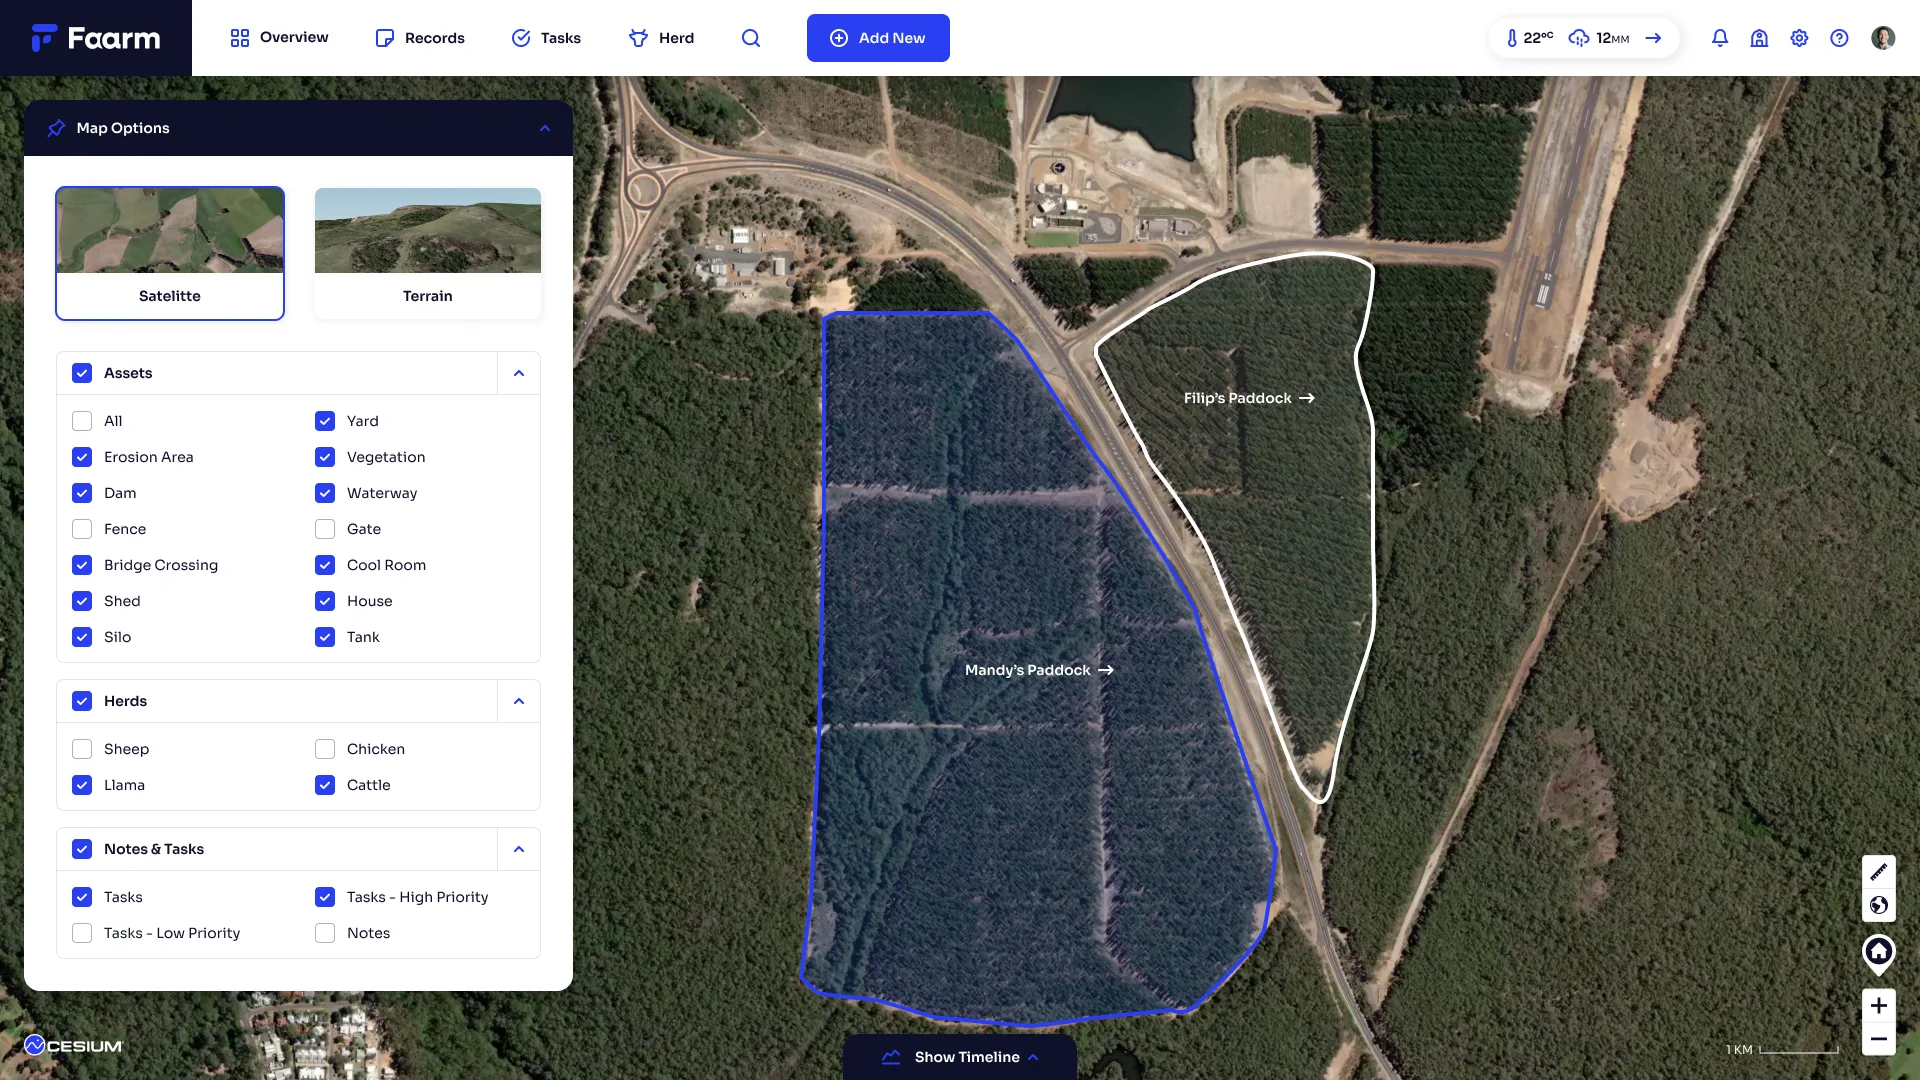
The placeDraw paddocks on satellite imagery and see the area, slope, herd, notes and tasks for each one.
- 02
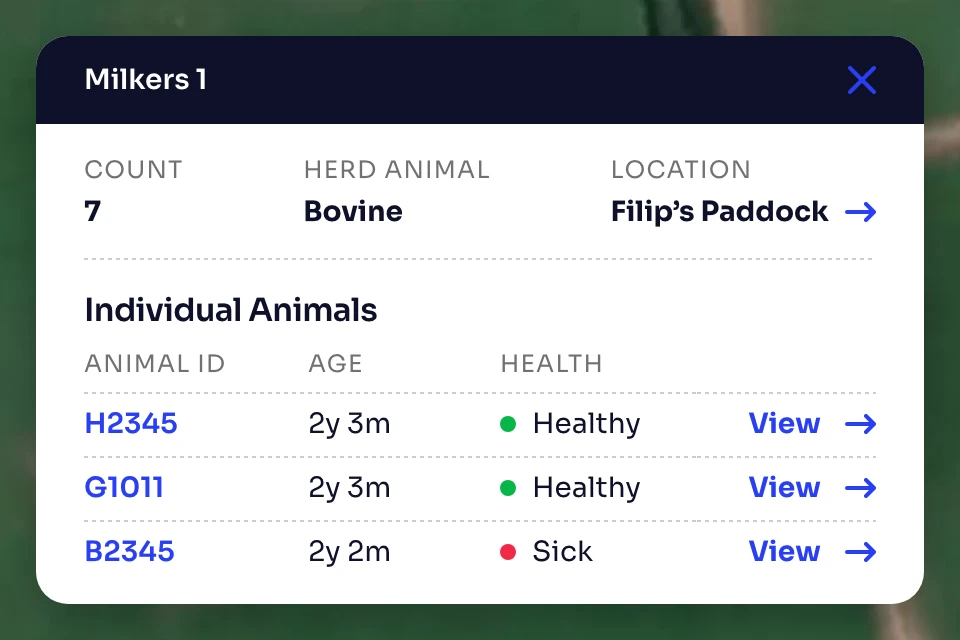
Herds and pasture
The animalsMove herds between paddocks, keep each animal's history, and track dry matter with a feed wedge.
- 03
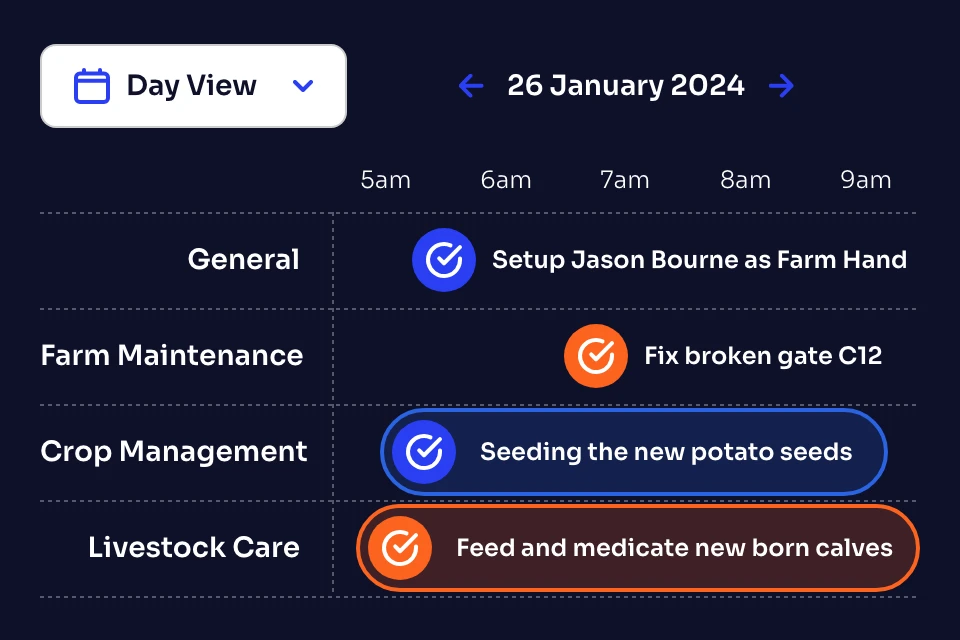
Tasks and timeline
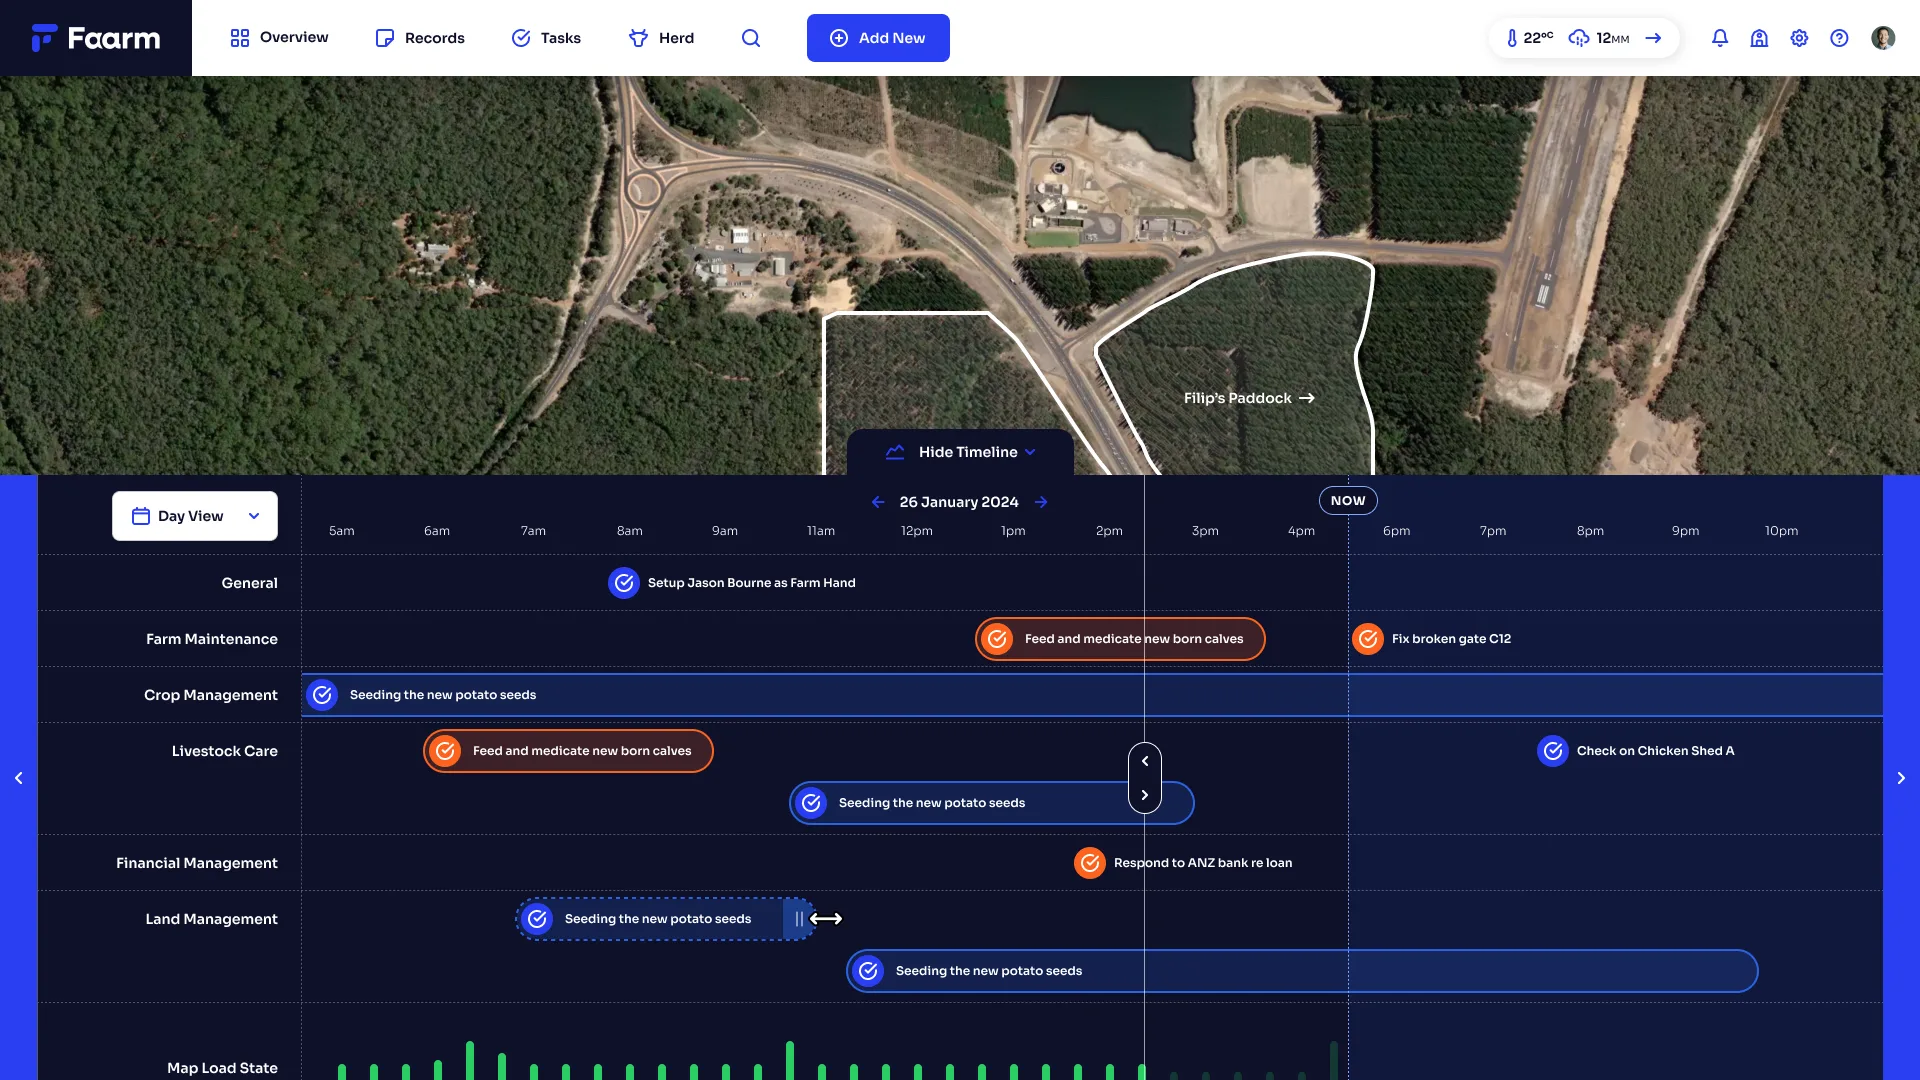
The workAssign jobs to people and paddocks, then see the day or the week on a timeline under the map.
- 04
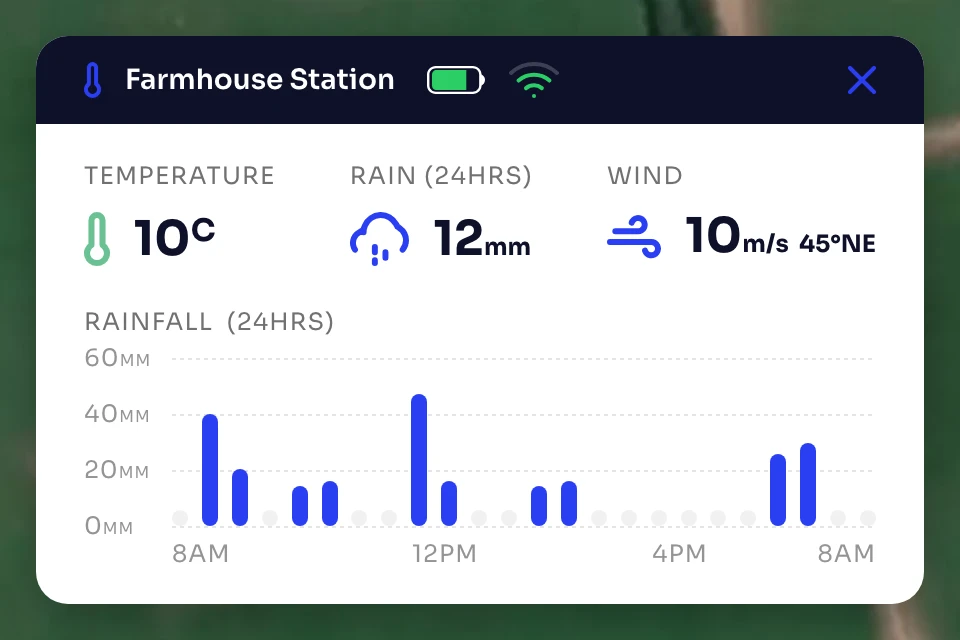
Sensors and cameras
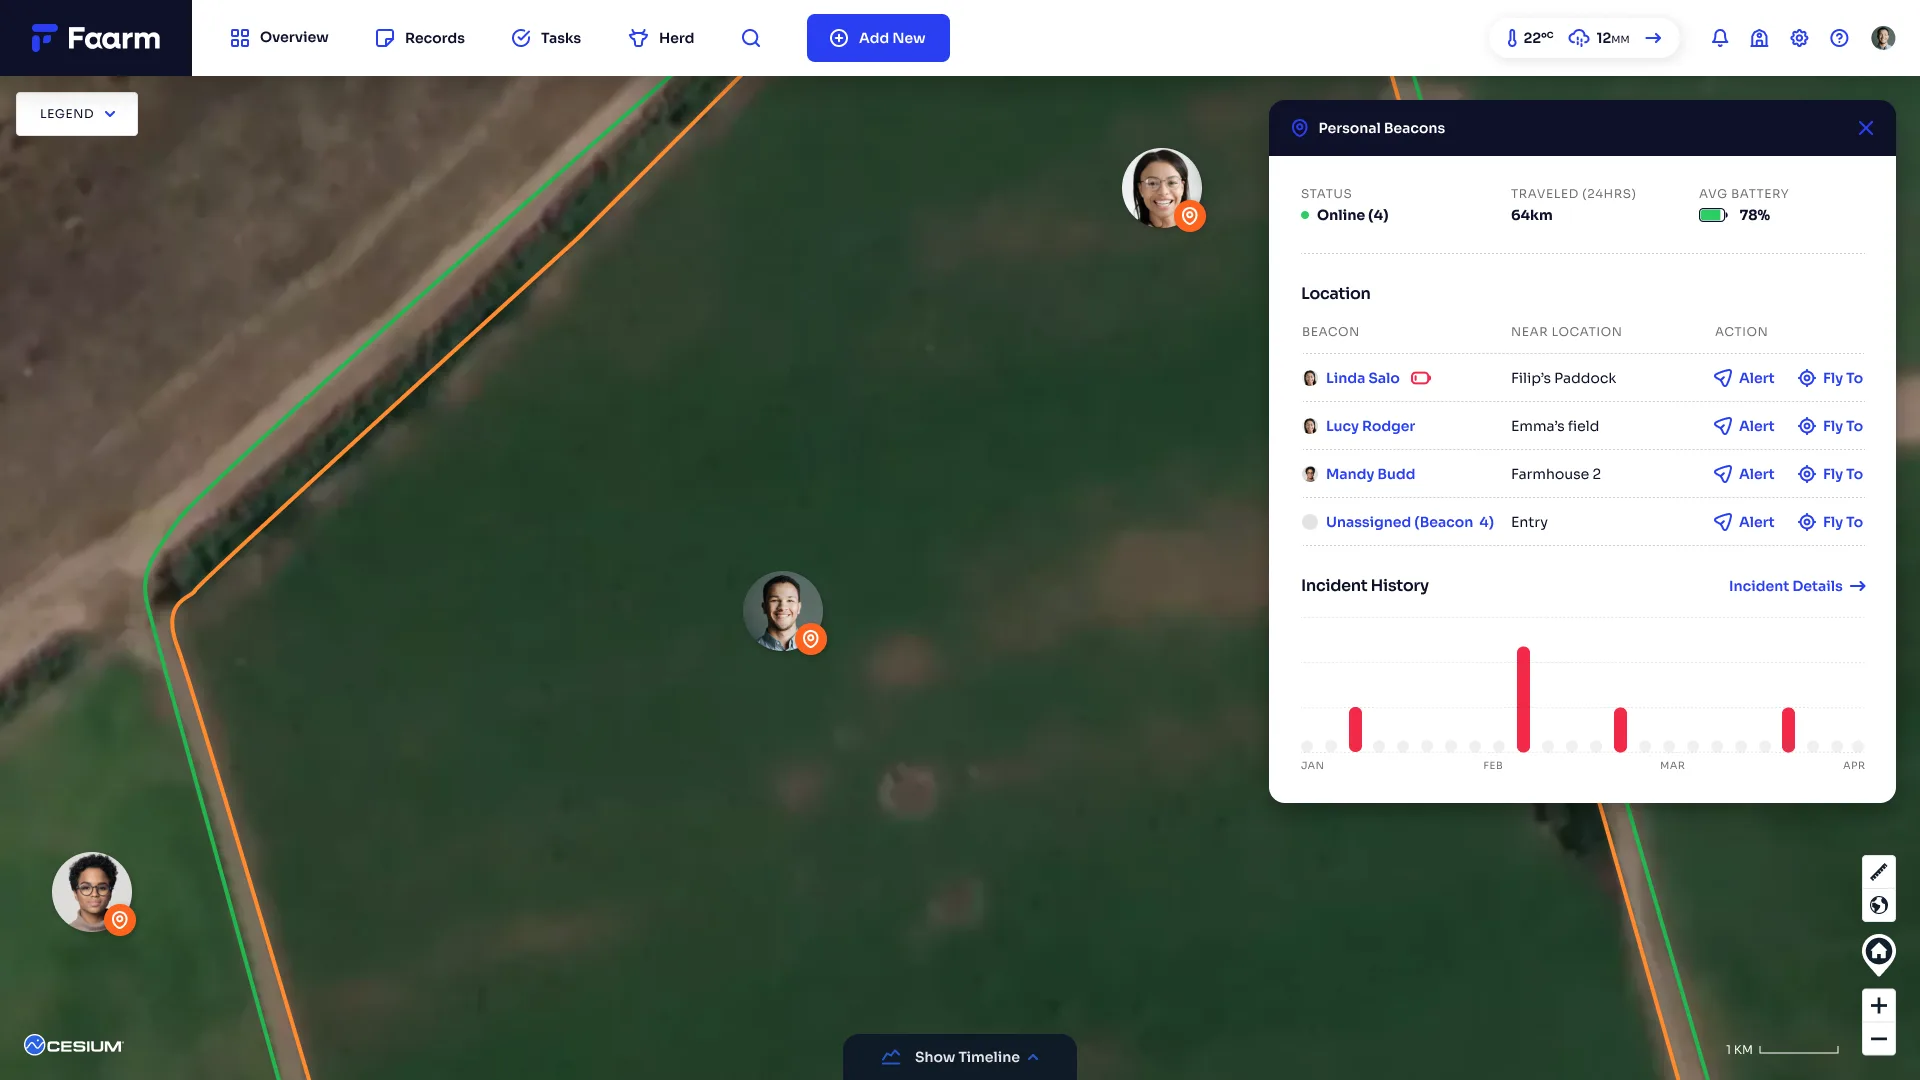
The hardwareWeather stations, water tanks, trail cameras, gateways and personal locator beacons in one list.
The decisions that mattered
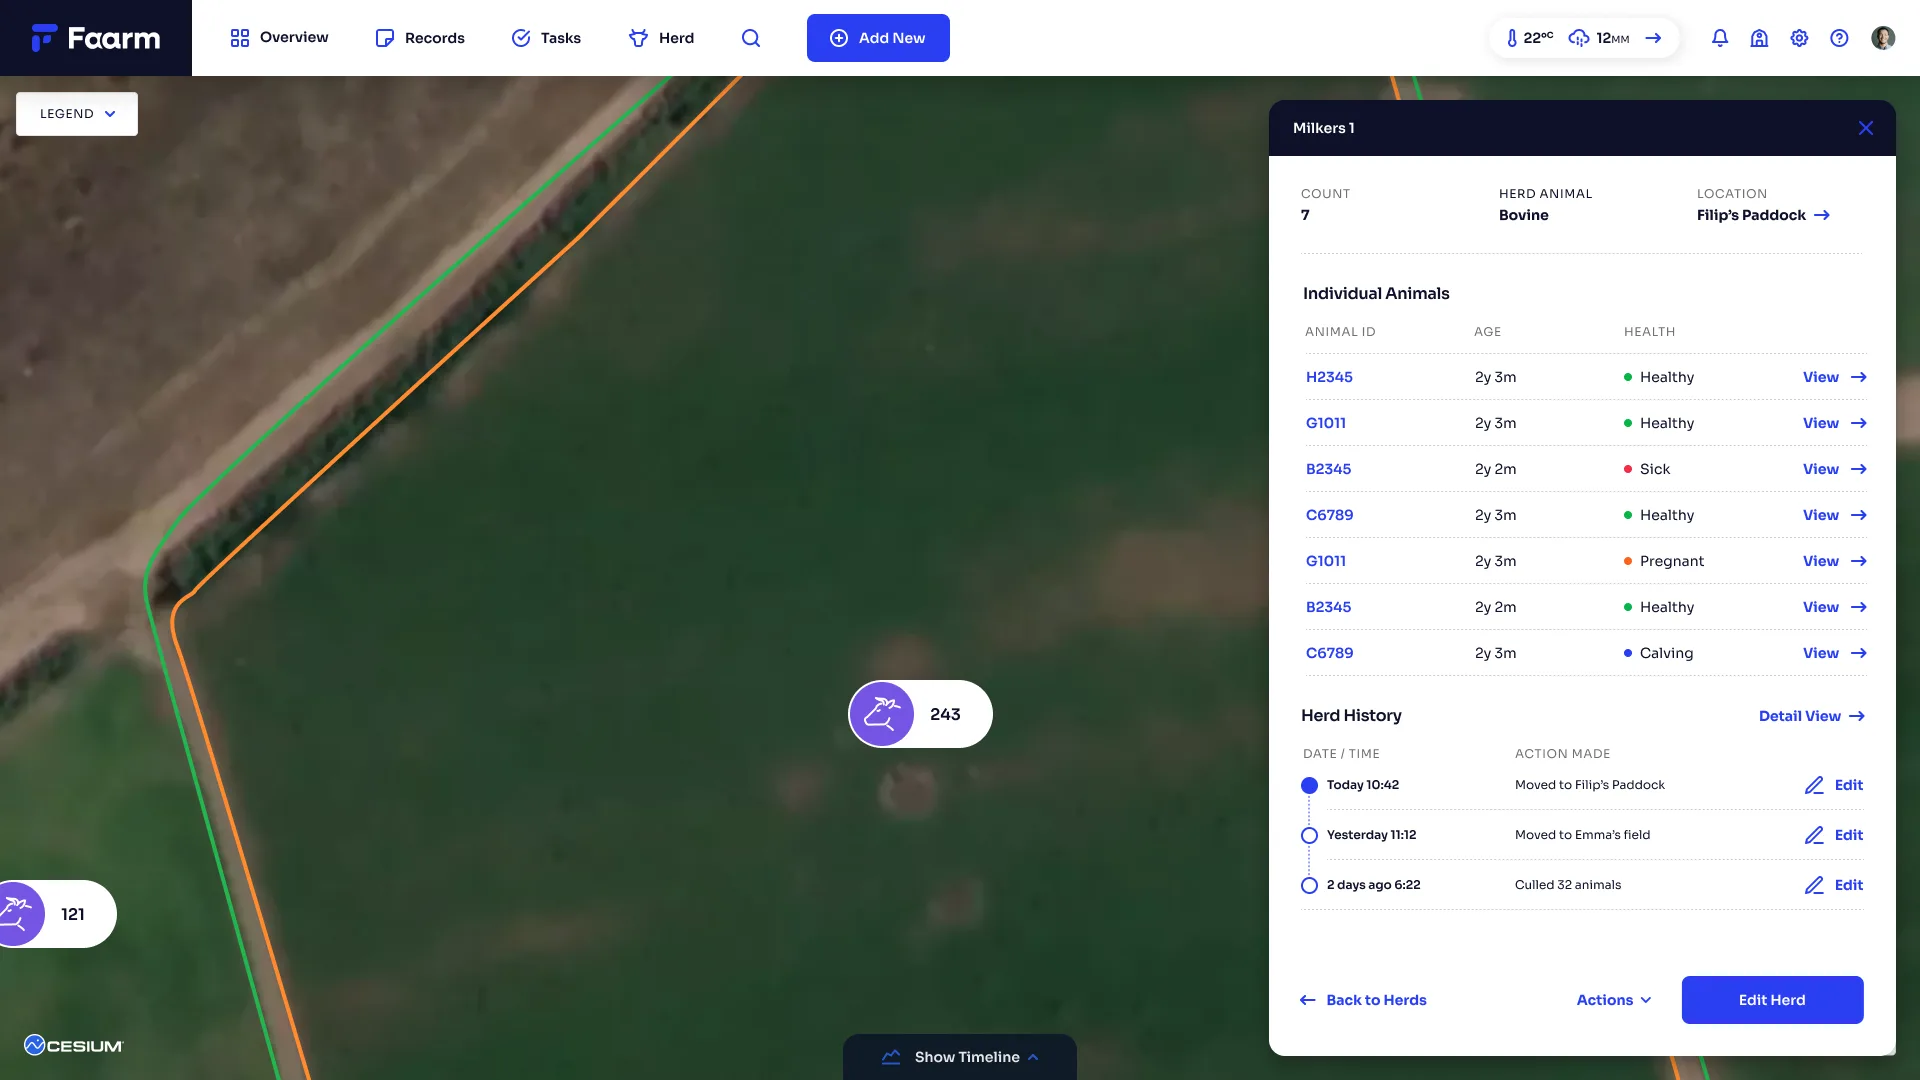
The map is the home screen
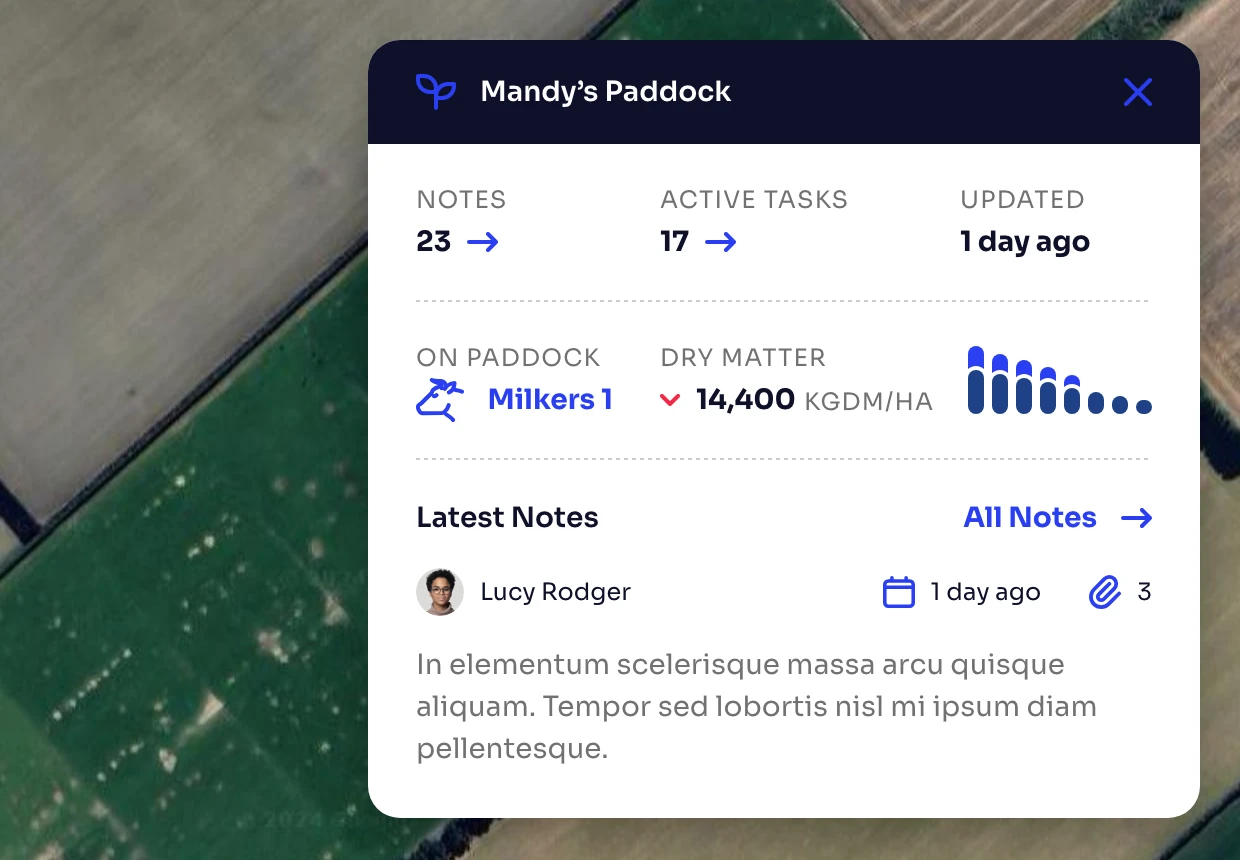
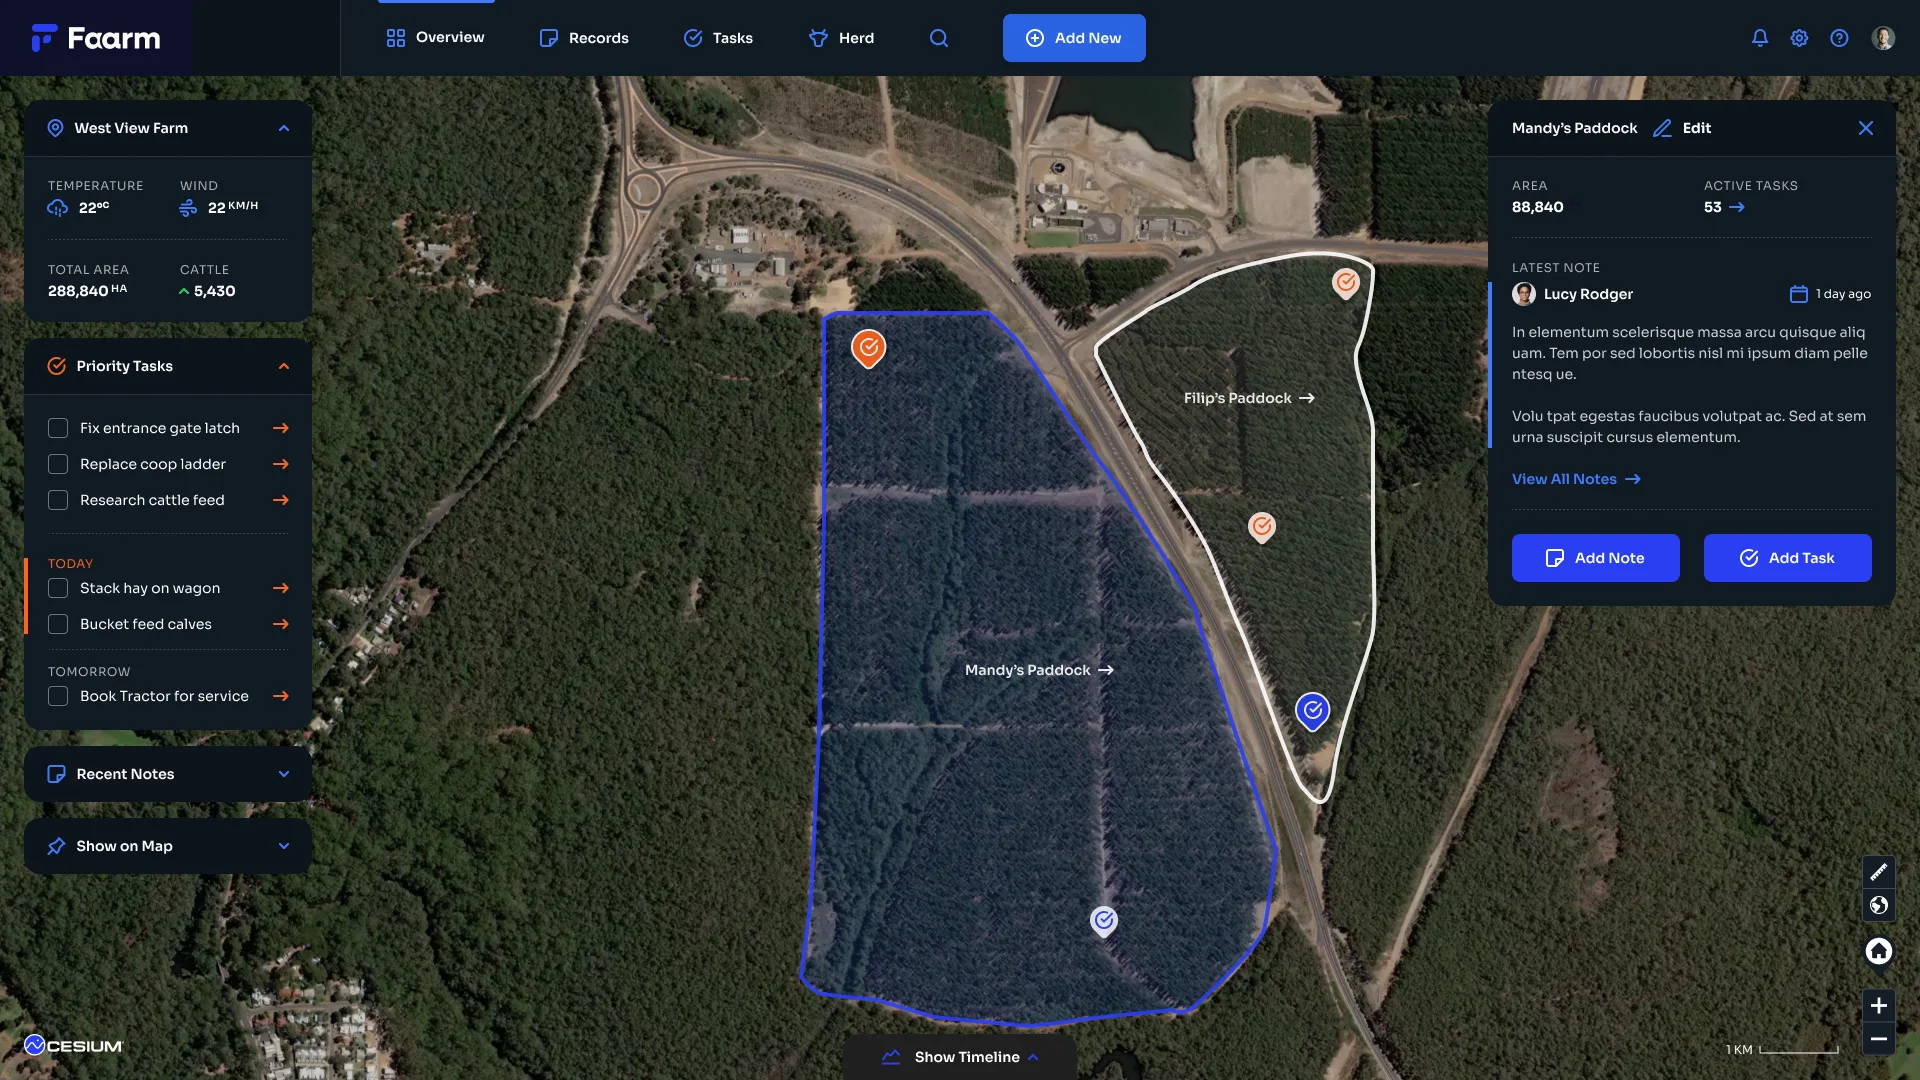
Open Faarm and you see your property from above, with every paddock outlined. Select a paddock and a panel opens over the map with its notes, tasks, herd and dry matter. Nothing takes you away from the map, so you never lose your place.
- Instead of
- A dashboard of tables and menus
- I chose
- The farm itself, with panels on top
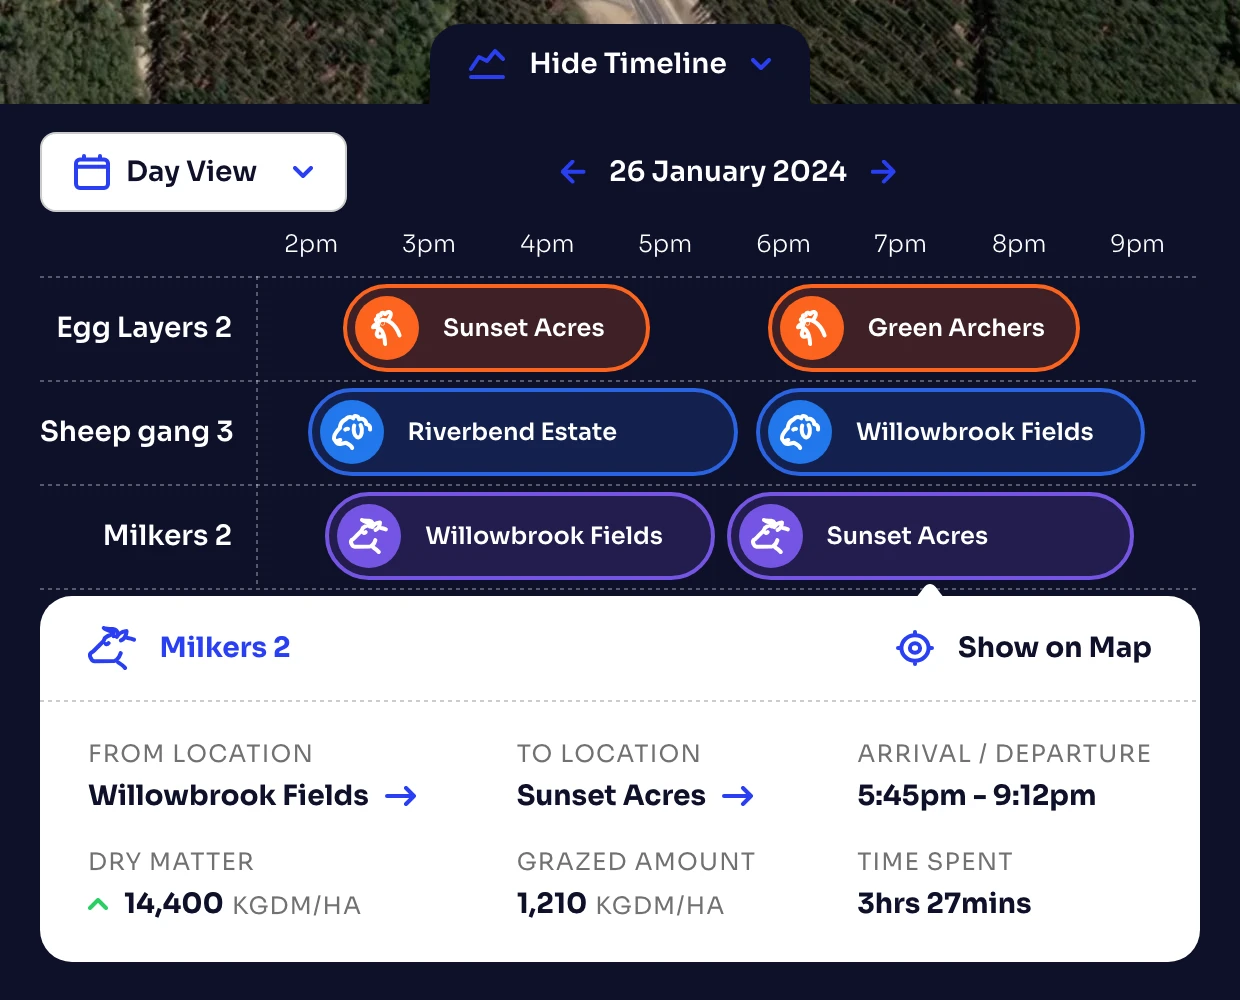
A timeline under the map
Where was each herd on Tuesday, and for how long? A drawer slides up from the bottom of the map and lays out every herd's moves through the day, hour by hour. Tasks use the same timeline, by day or by week.
- Instead of
- A log of dated records
- I chose
- A day you can read left to right
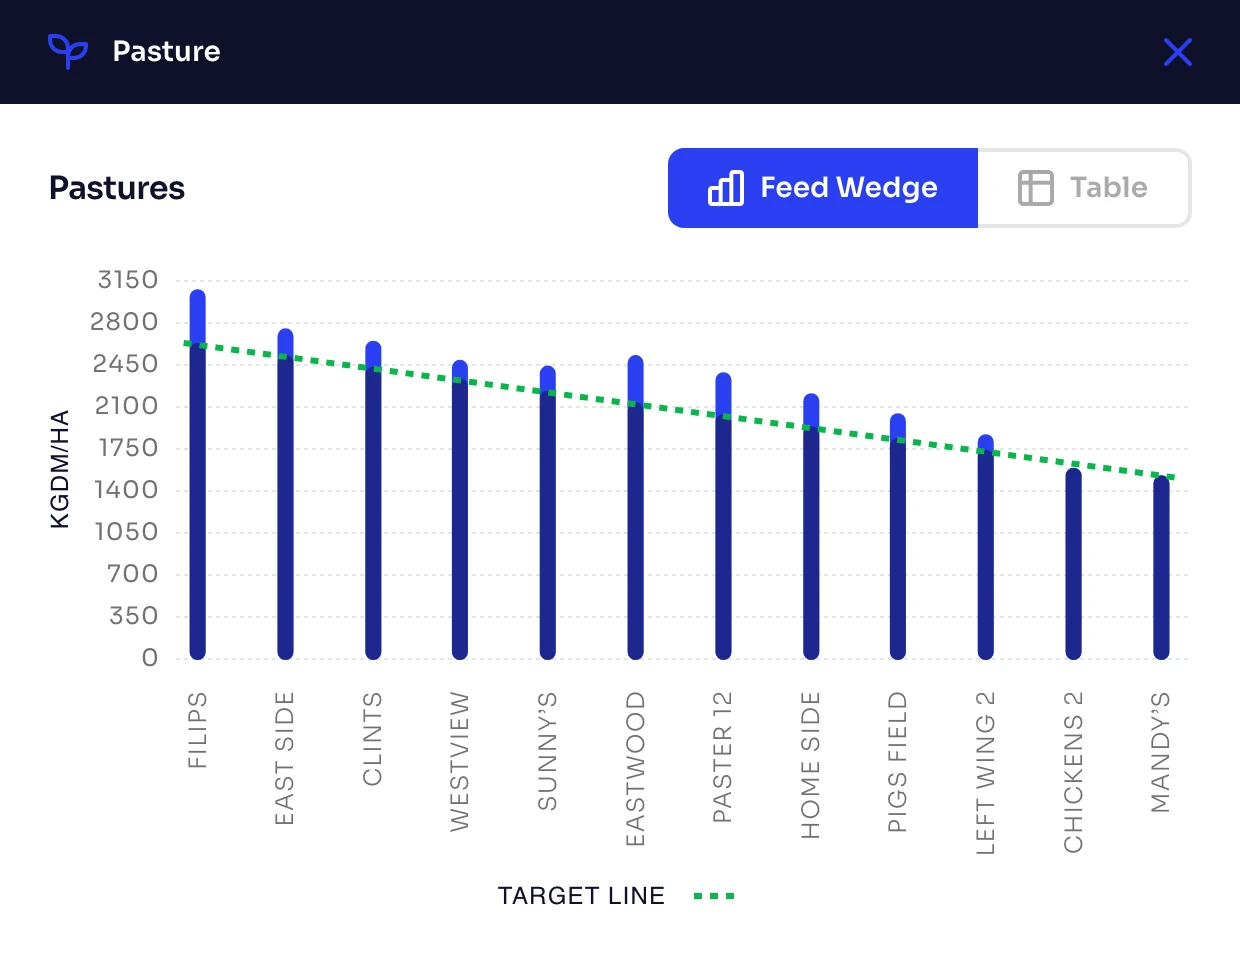
The chart graziers already use
Graziers rank their paddocks by how much feed is on them and compare that with a target. The chart is called a feed wedge, and it is how pasture decisions already get made. Faarm draws it from the farm's own pasture records, against a target line the farmer sets.
- Instead of
- A new kind of pasture report
- I chose
- The feed wedge, drawn from their own records
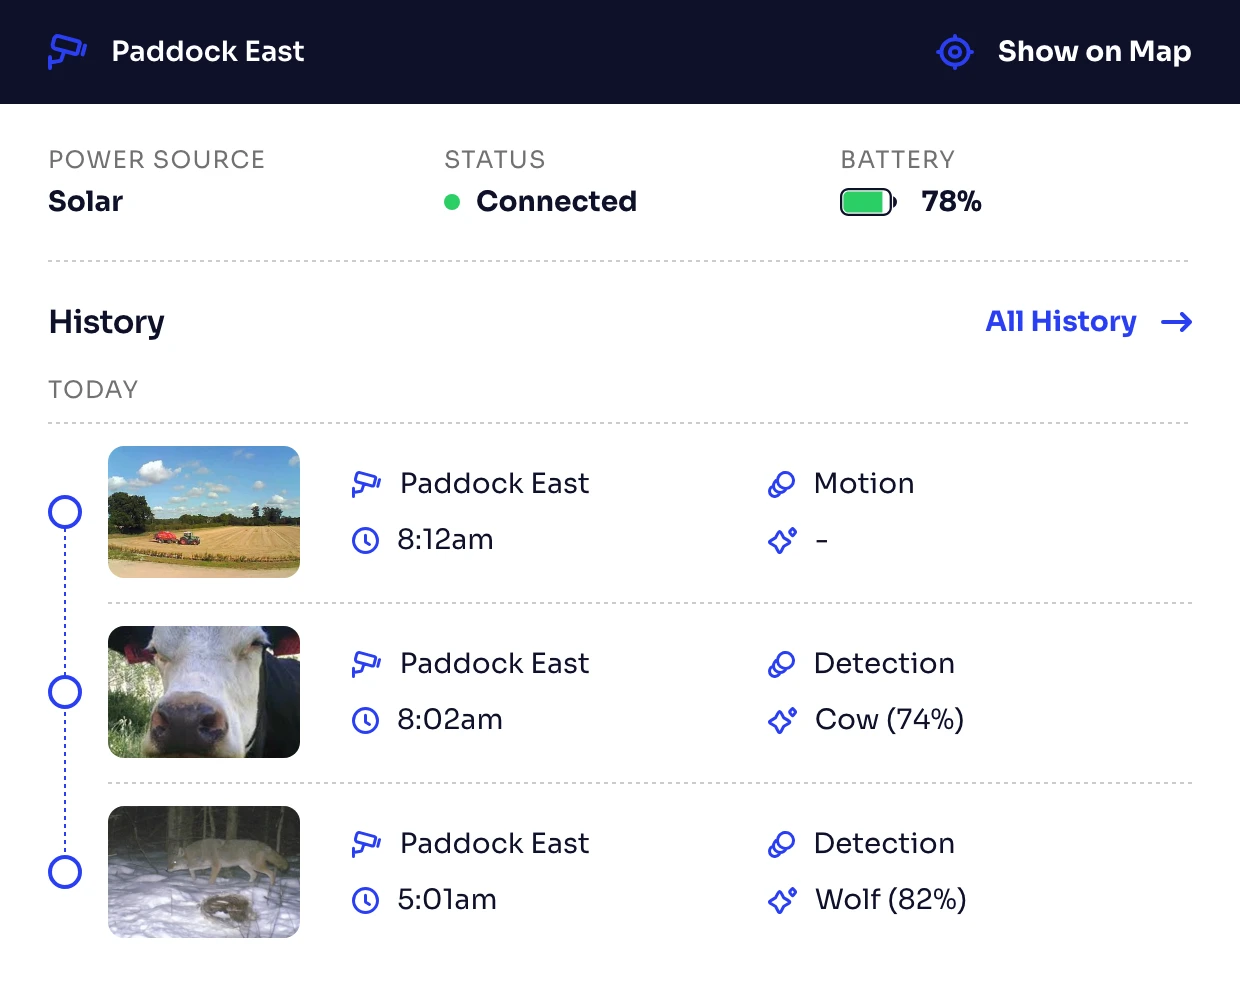
Every device opens the same panel
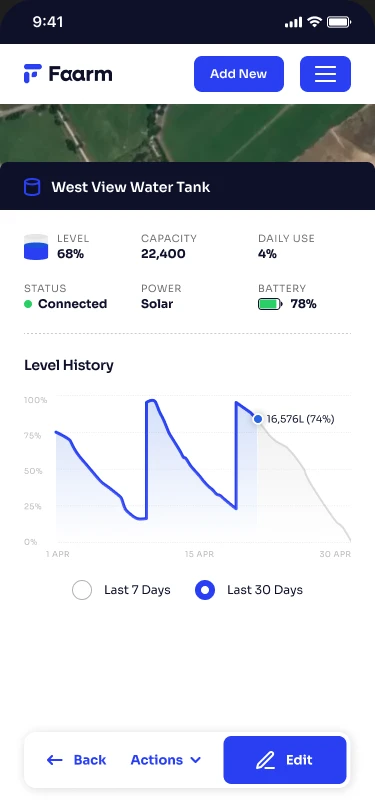
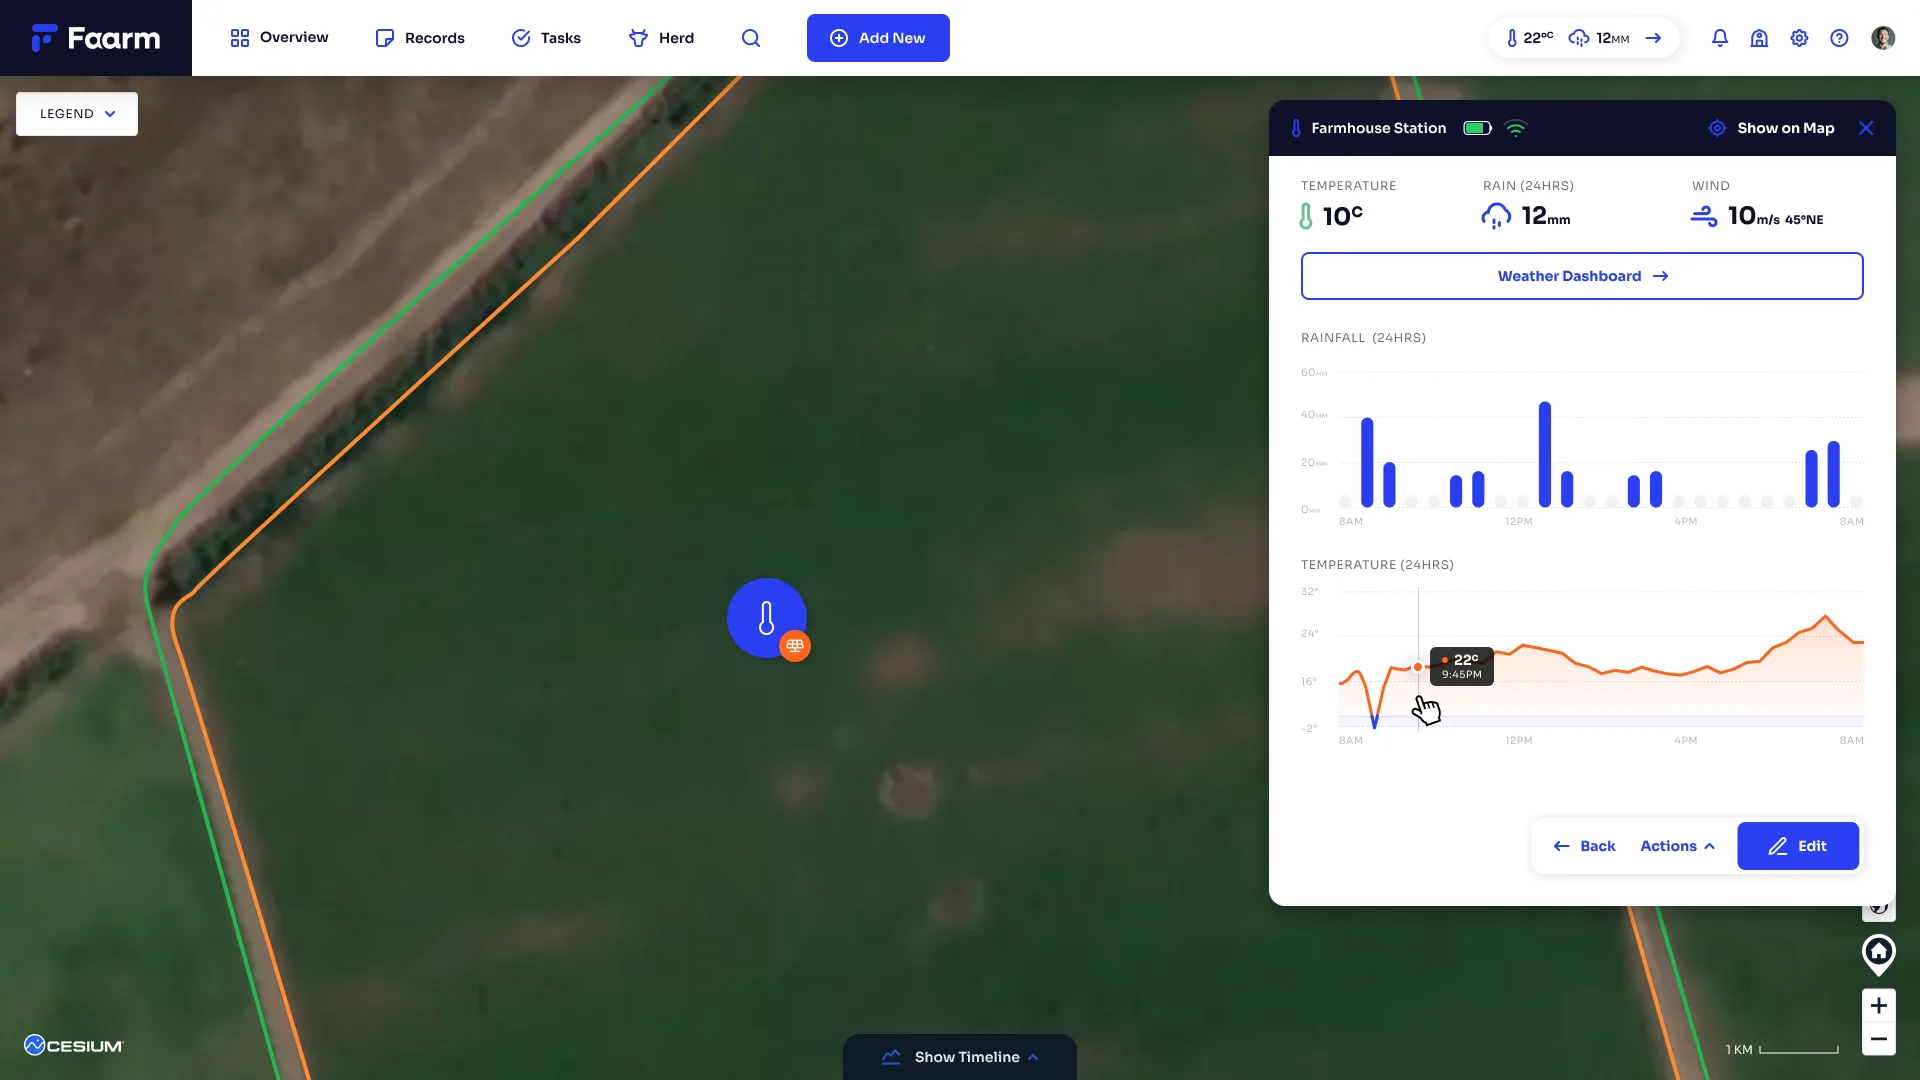
A farm might have forty devices from a dozen makers. Each one opens the same panel, with status, power and battery at the top and history underneath. A camera's overnight detections and a tank's water level read the same way.
- Instead of
- A different screen for each kind of device
- I chose
- One panel pattern for all of them
Designed for the gate, not the desk
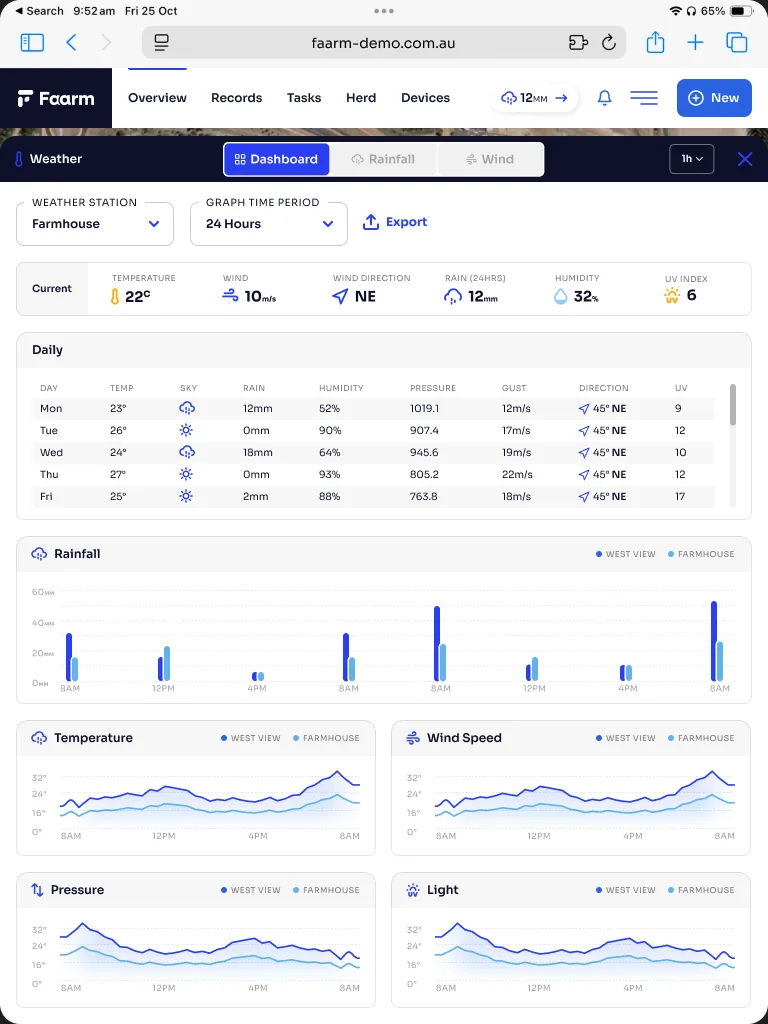
A farmer checks a tank level standing beside the tank. The panels were redesigned for iPad and phone, with the map still underneath, larger touch targets and a menu within reach of a thumb.
- Instead of
- The desktop app, shrunk to fit
- I chose
- Layouts made for iPad and phone


01 / 04
More of the product
Six more screens from the several hundred in the design file.
Where it is now
Faarm is preparing to launch. Farmers across Australia and New Zealand are being invited into a two-week co-design trial, using the platform on their own properties and reporting back on what works.
There are no adoption numbers to report yet.
One view
Paddocks, herds, pasture, tasks and devices on a single map.
Any hardware
The same panel for every sensor, whoever makes it.
Three screen sizes
Designed for desktop, iPad and phone.
Building software for people who work outdoors?
If your users would rather be outside than in your product, every screen has to earn its place. I can help with that.