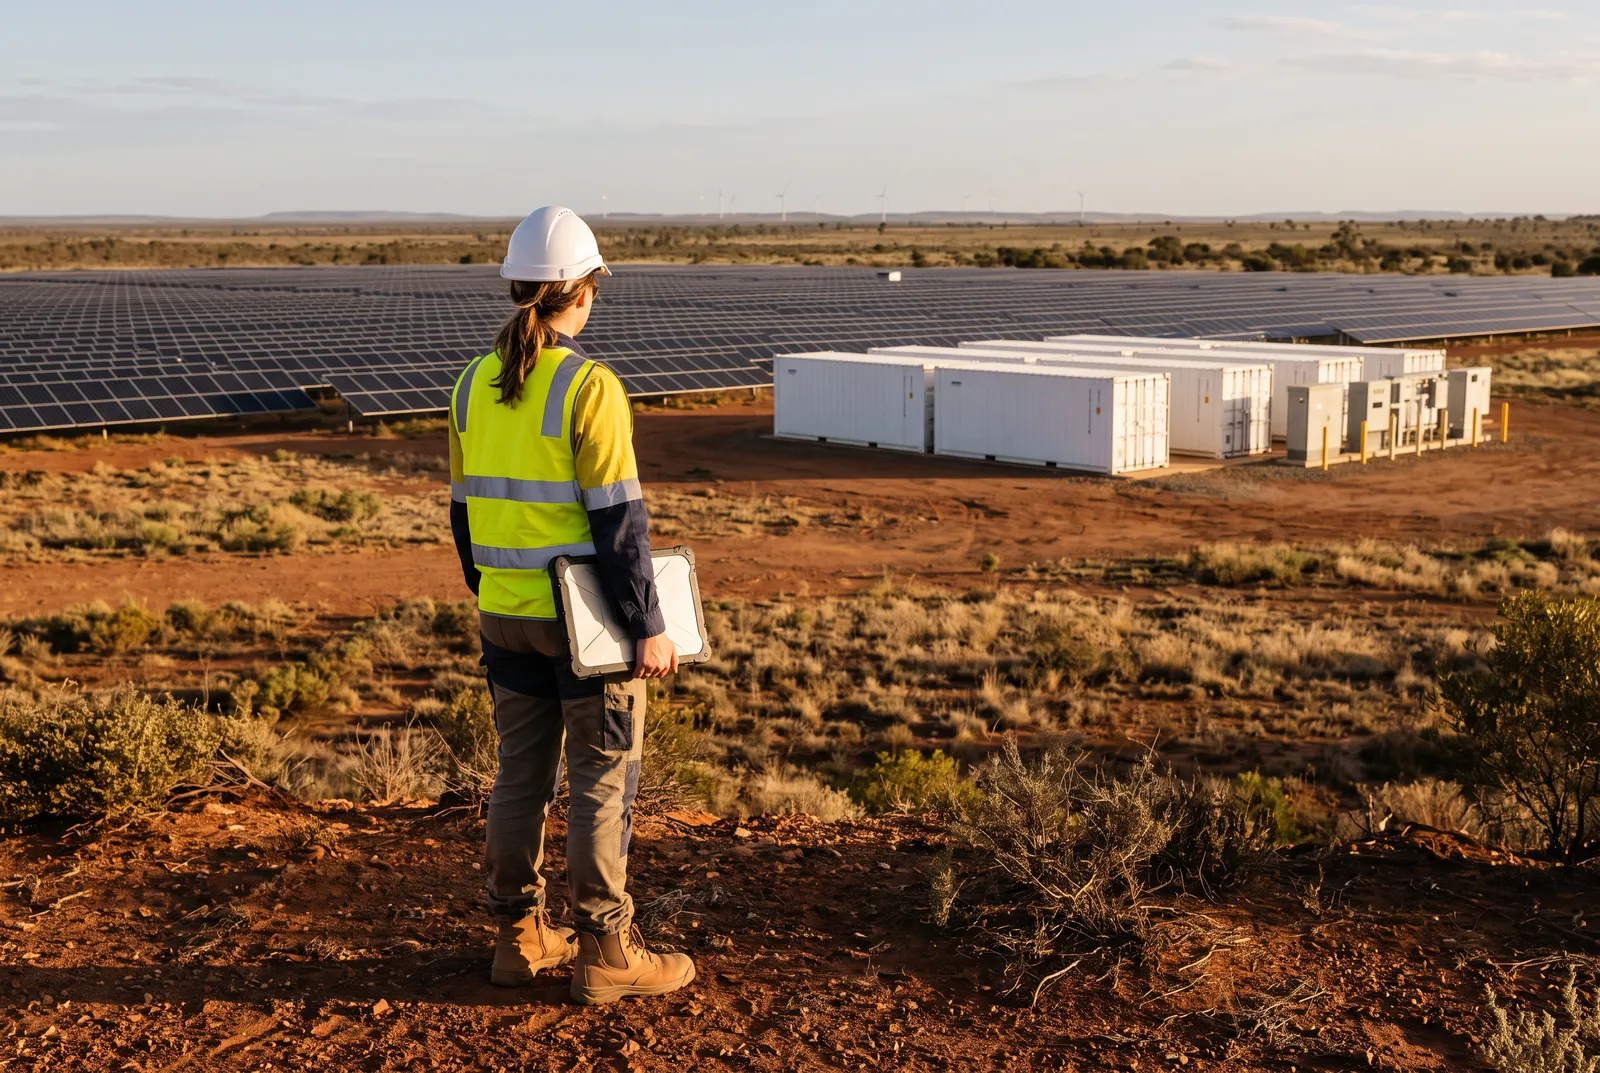
Gridcog is simulation software for planning energy projects: solar, batteries, wind, EV charging and the markets they trade in. I've worked with the product team on the planning app, from the first version under the name Gridcognition to today's project designer and library.
gridcog.com ↗- Client
- Gridcog
- Energy modelling software, London and Perth
- My role
- Product designer
- Product strategy, UX and UI
- Scope
- Planning app
- Project designer, library and chat
- In use
- 18,000+ projects
- Modelled across 40+ markets, per Gridcog
The problem
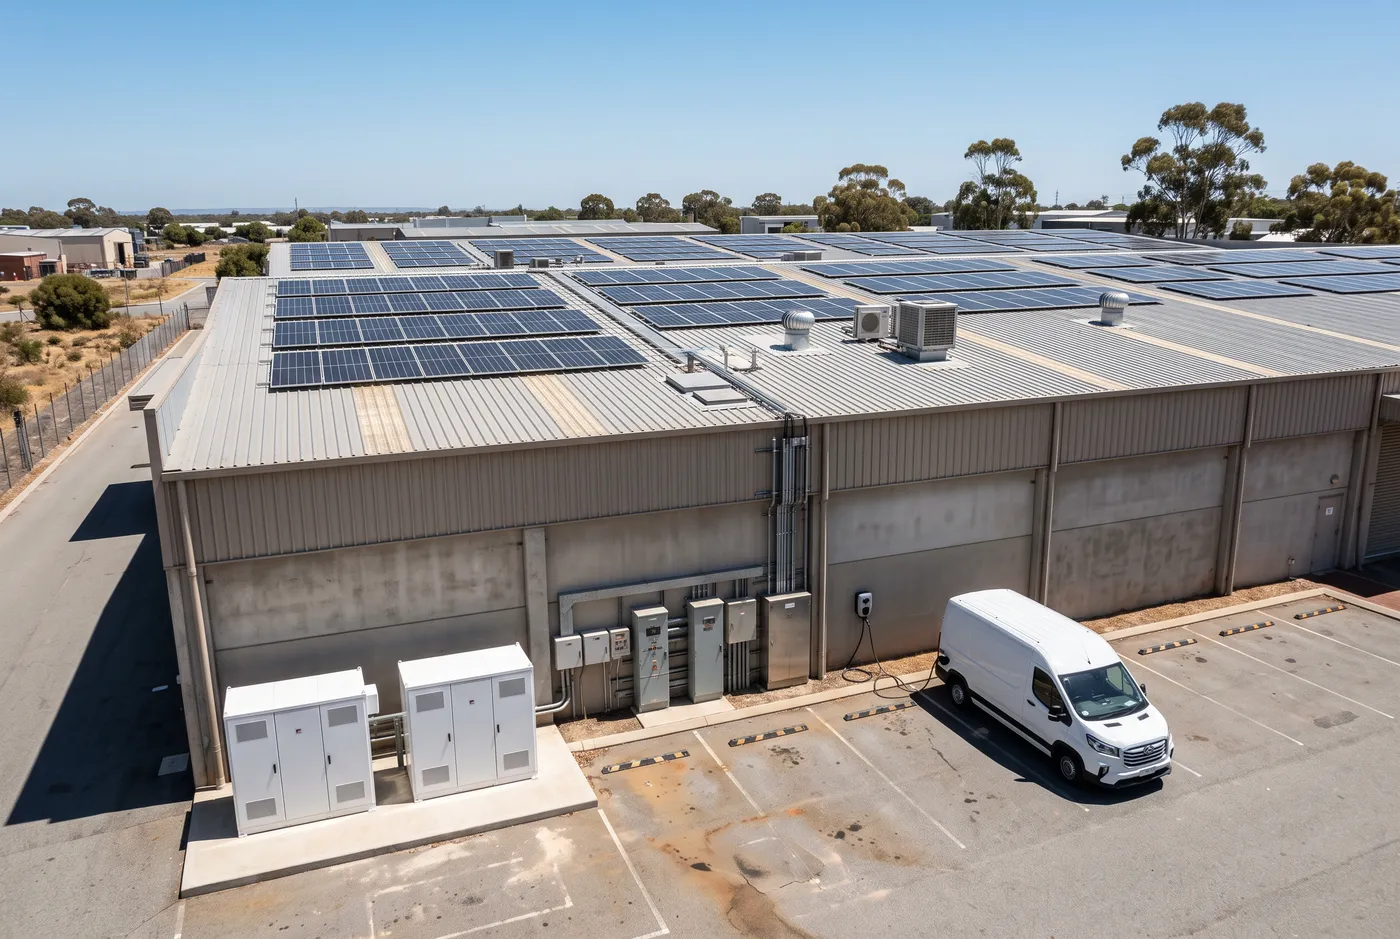
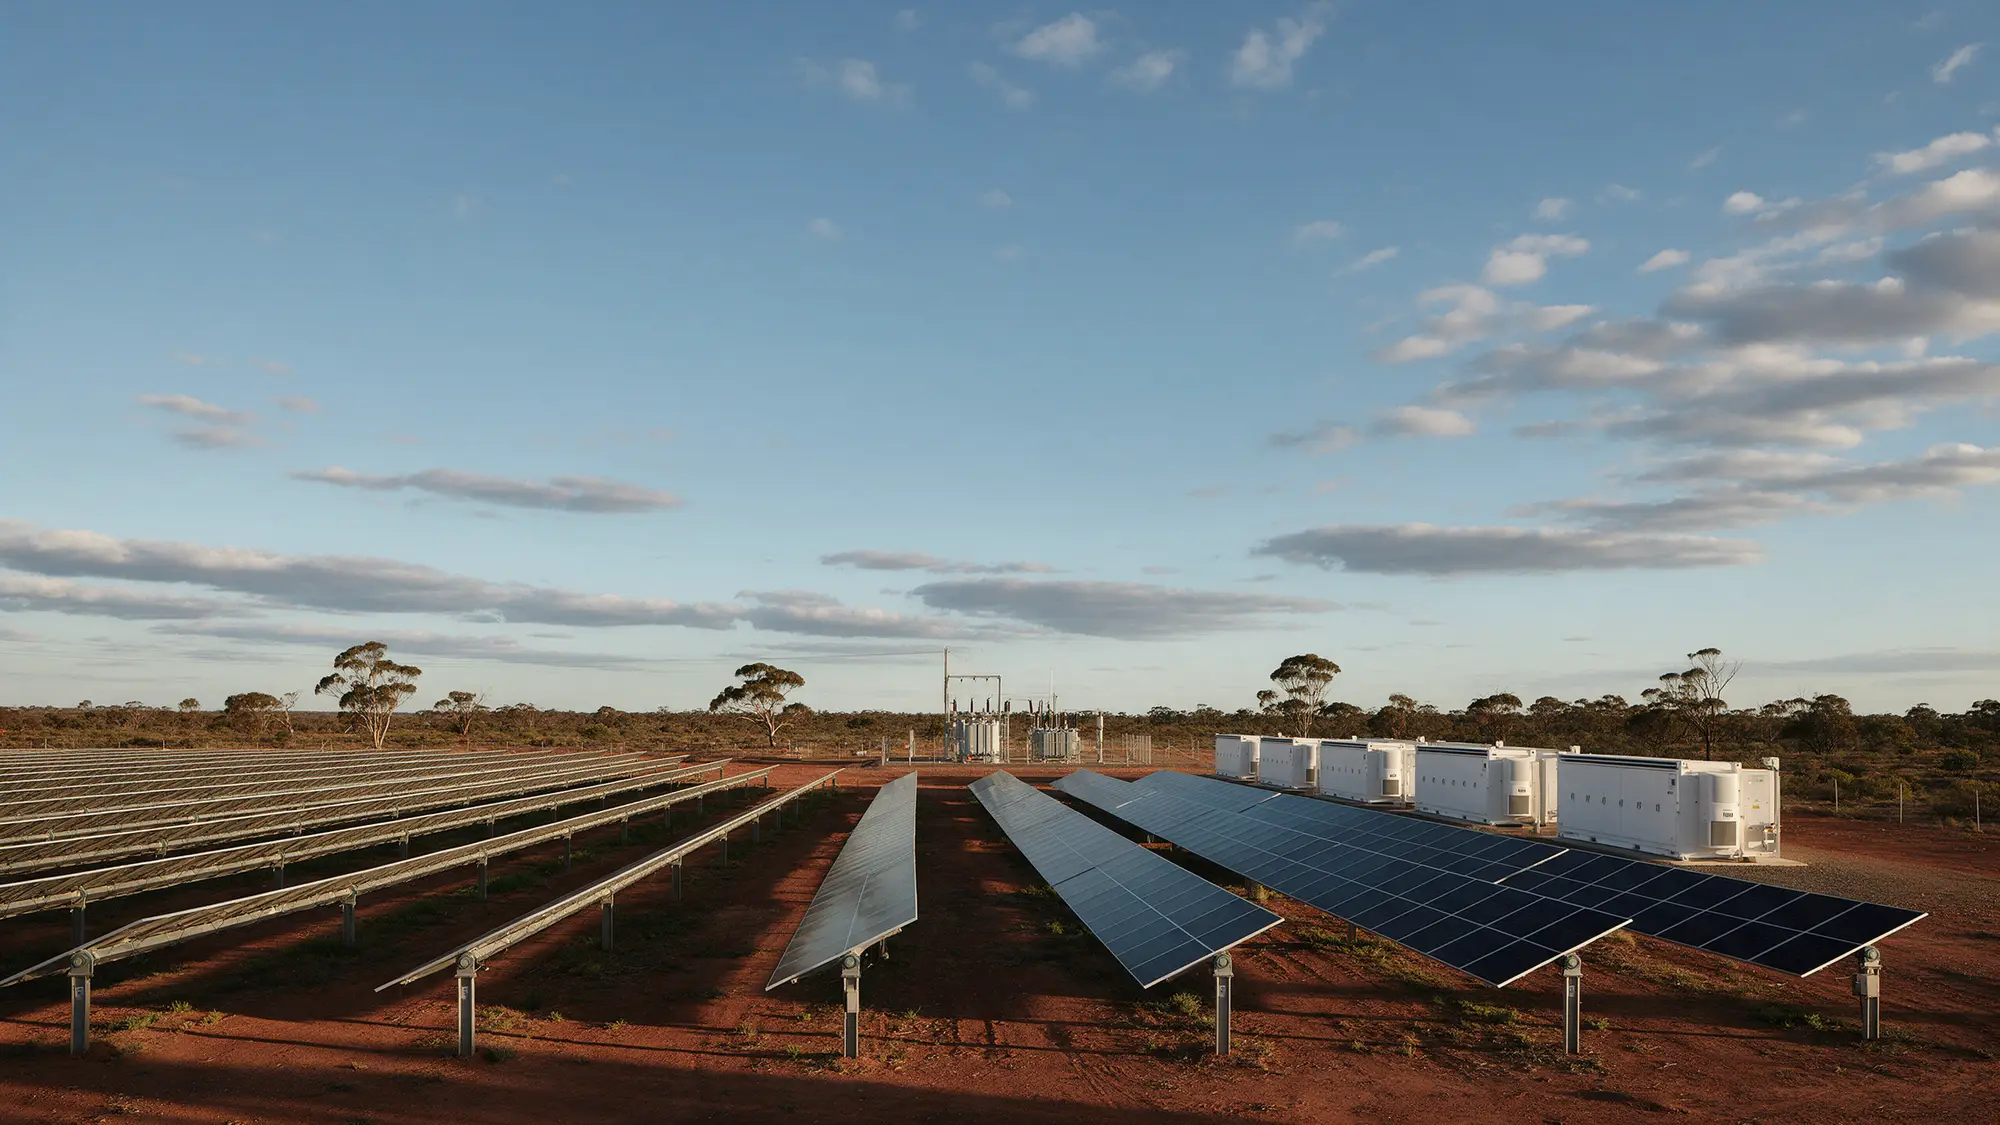
An energy project used to be one asset selling into one market. Now it is solar with a battery beside it, charging from the grid when prices are low, selling into several markets at once, and splitting the money between an owner and an optimiser.
Working out whether that stacks up means modelling the physical site, the commercial deal and the operating strategy together, across dozens of scenarios. Many teams still do it in spreadsheets that only their author can follow.
Gridcog replaces the spreadsheet. Its users are experts who need every parameter, and the answer still has to make sense to the people approving the spend.
A model has hundreds of inputs. The screen should show the few that matter right now.
What I designed
- 01
Projects
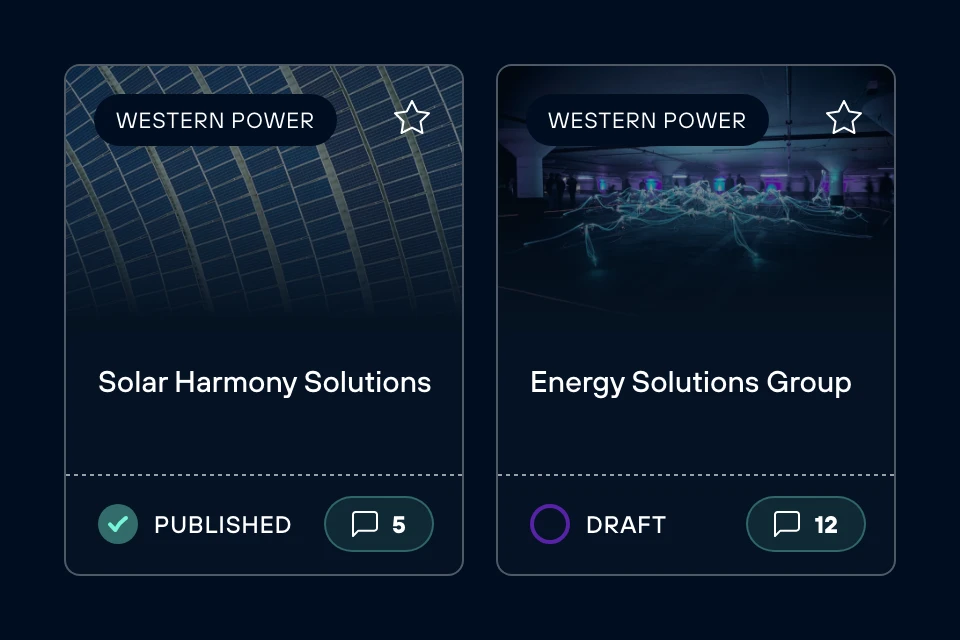
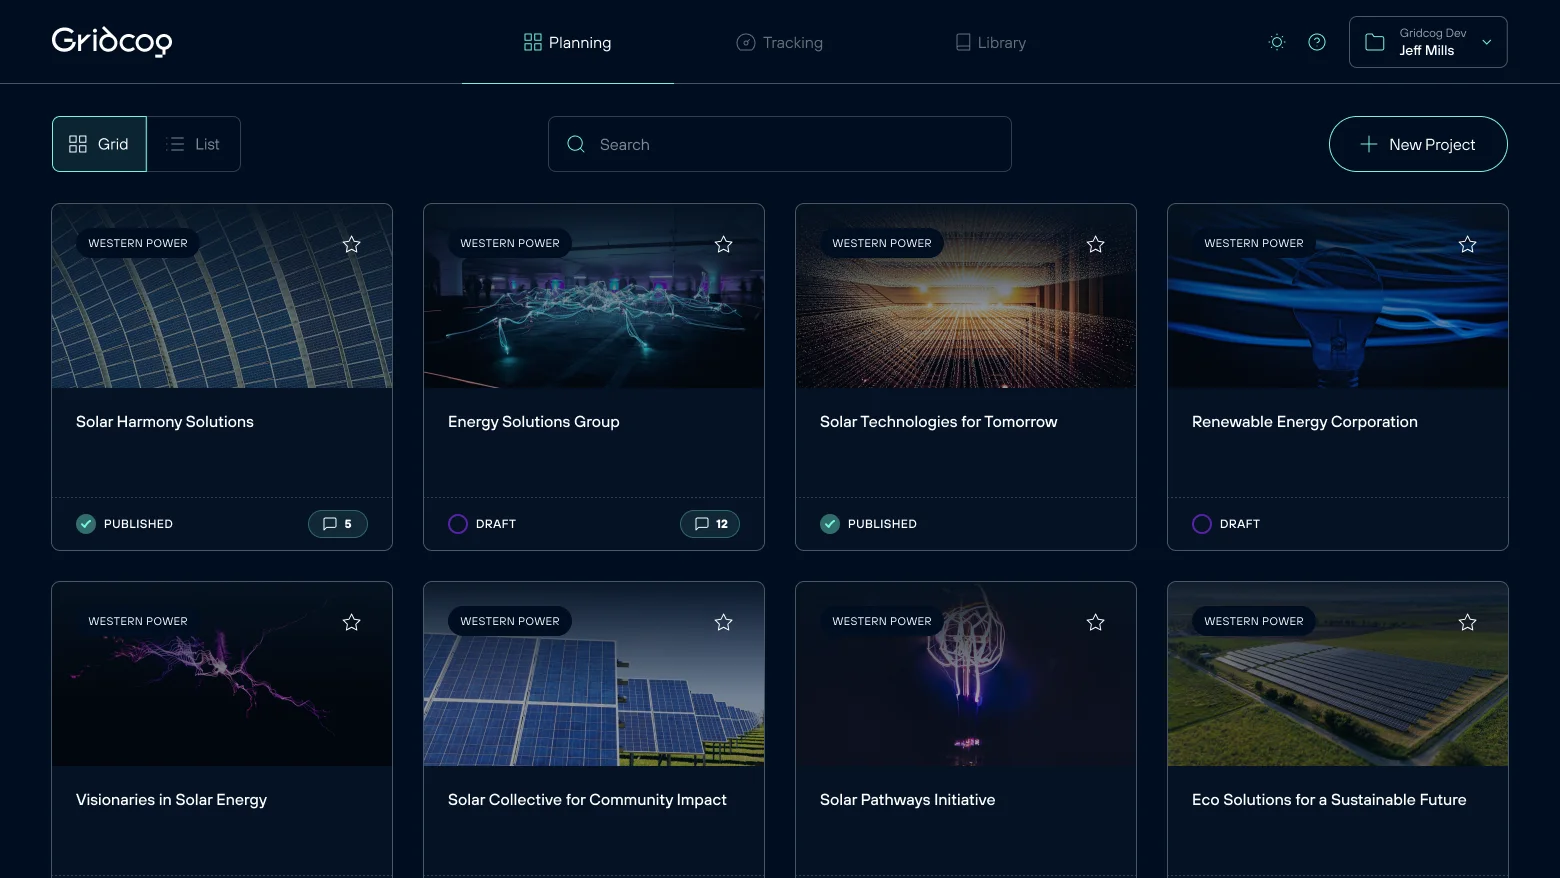
Where work startsEvery project a team is planning, as cards with their status and comments.
- 02
Project designer
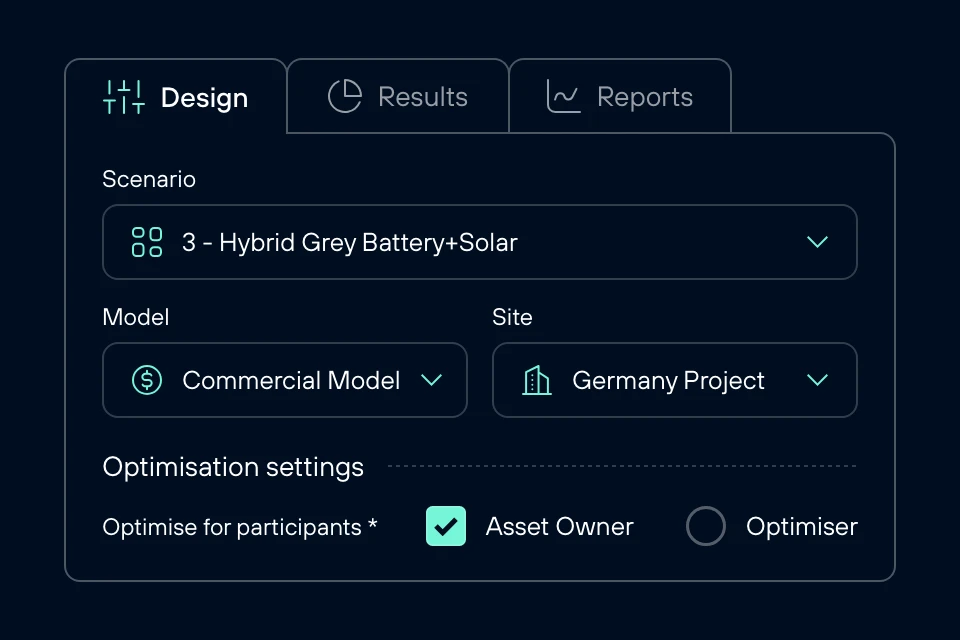
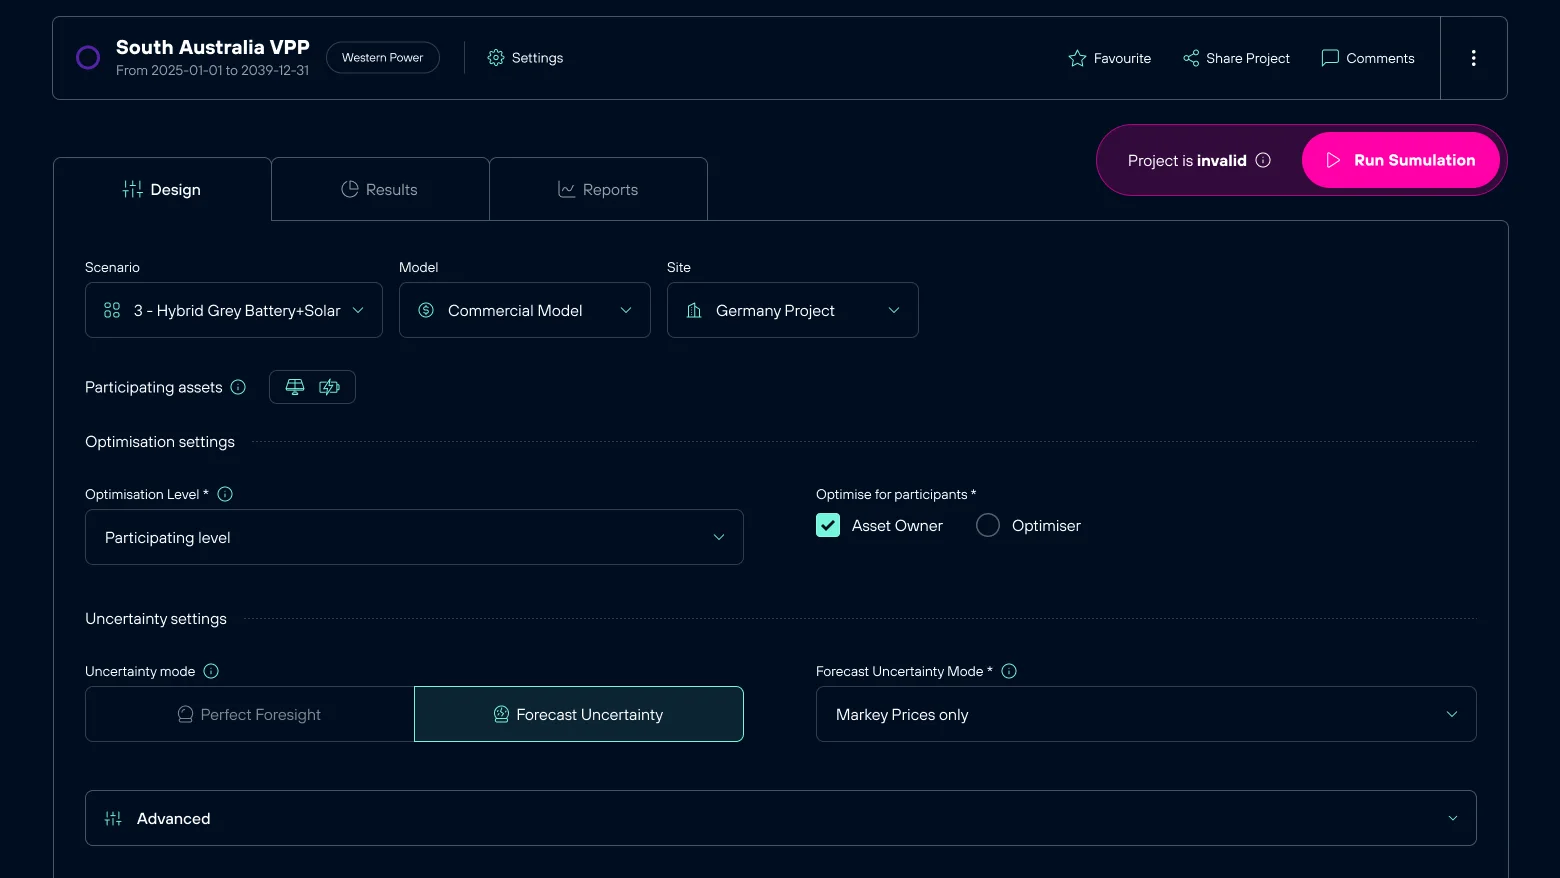
Where the model is builtScenarios, each with a physical, a commercial and an optimisation model.
- 03
Library
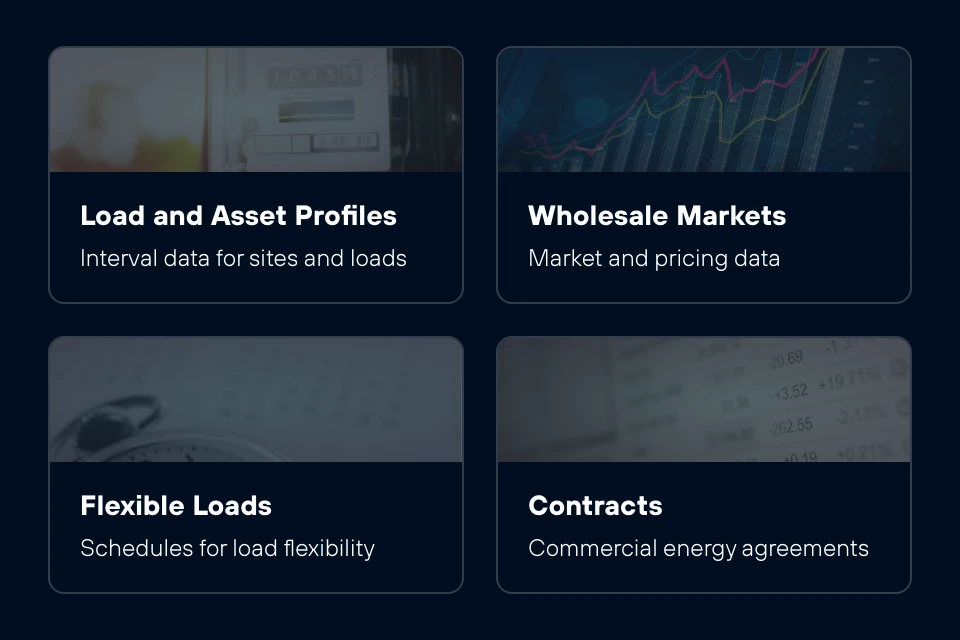
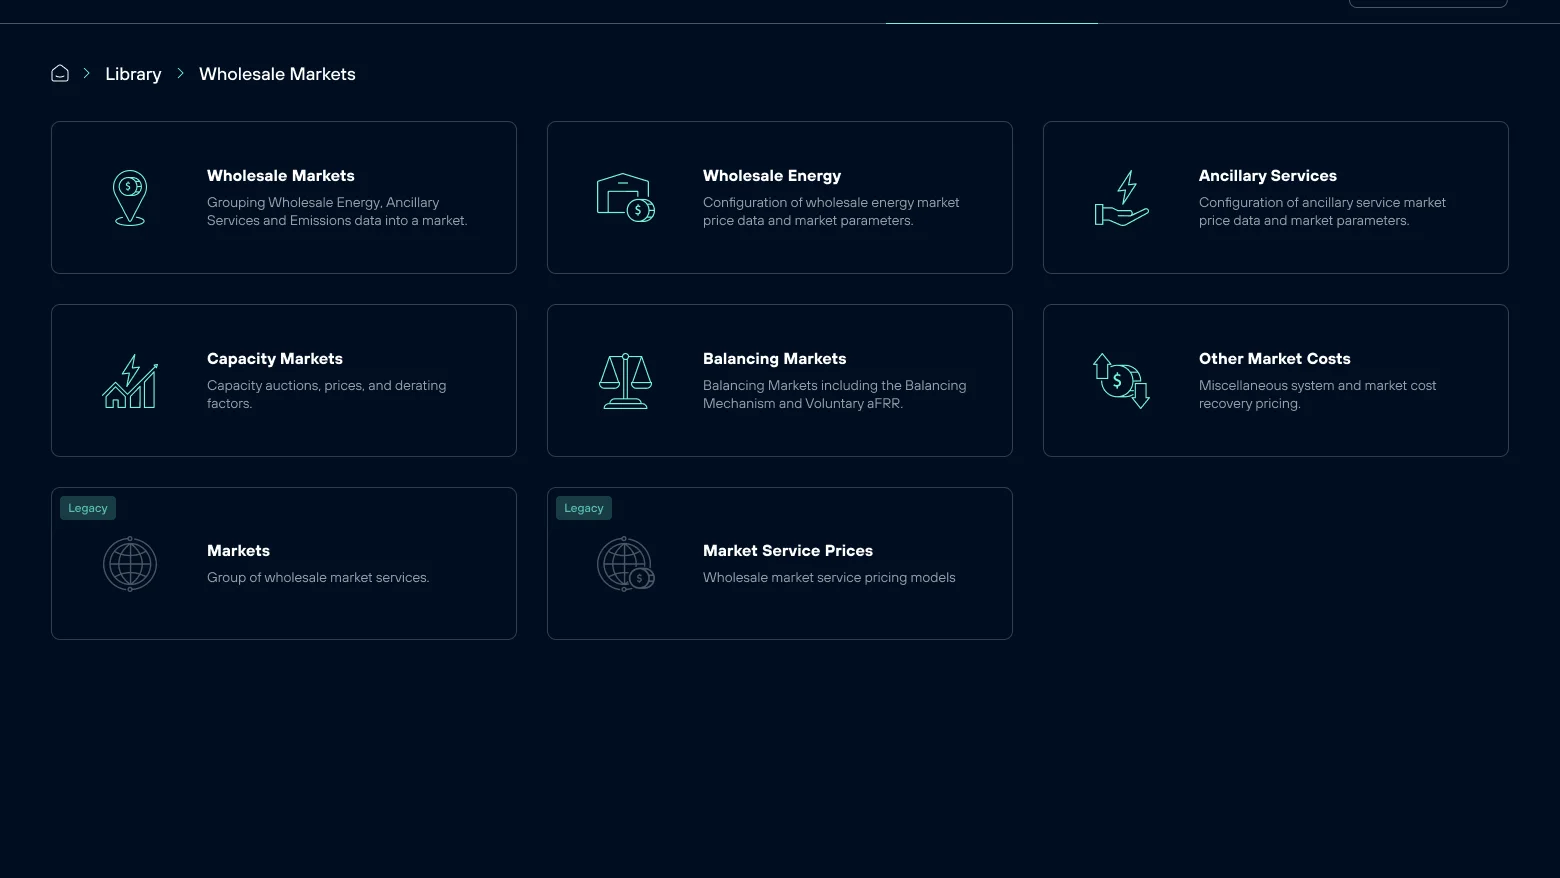
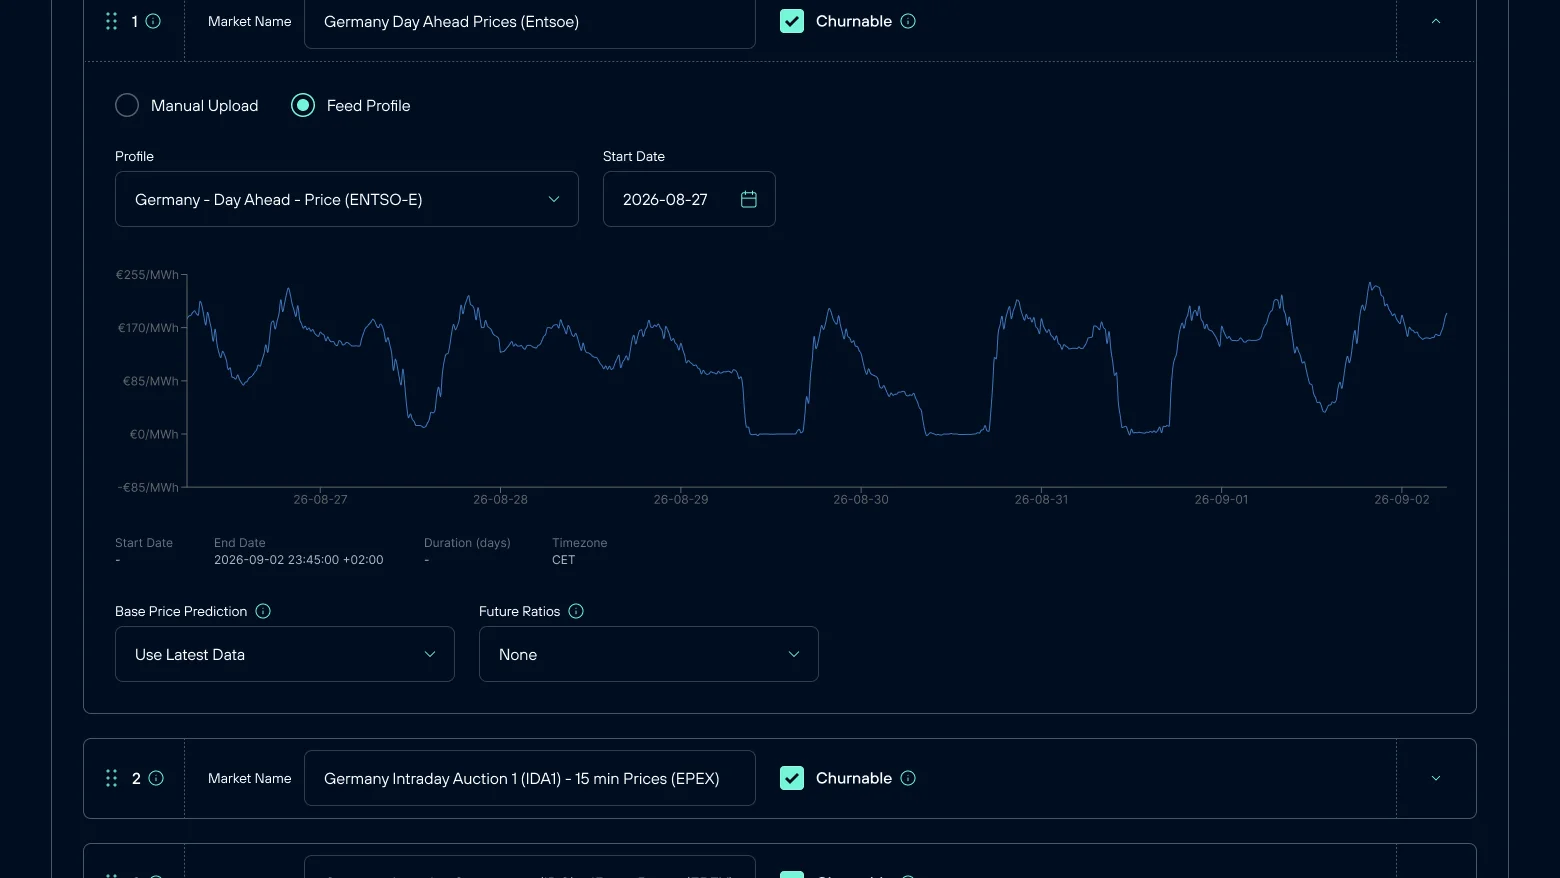
Where assumptions liveTariffs, market prices, load profiles and costs, shared across projects.
- 04
Chat
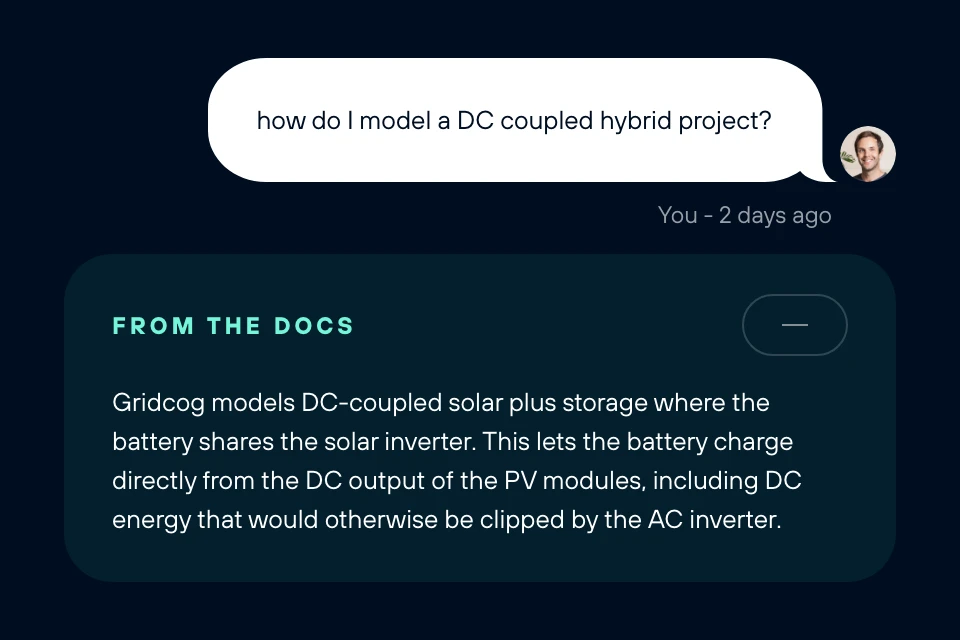
Where questions get answeredTeam comments and answers from the documentation, beside the work.
The decisions that mattered
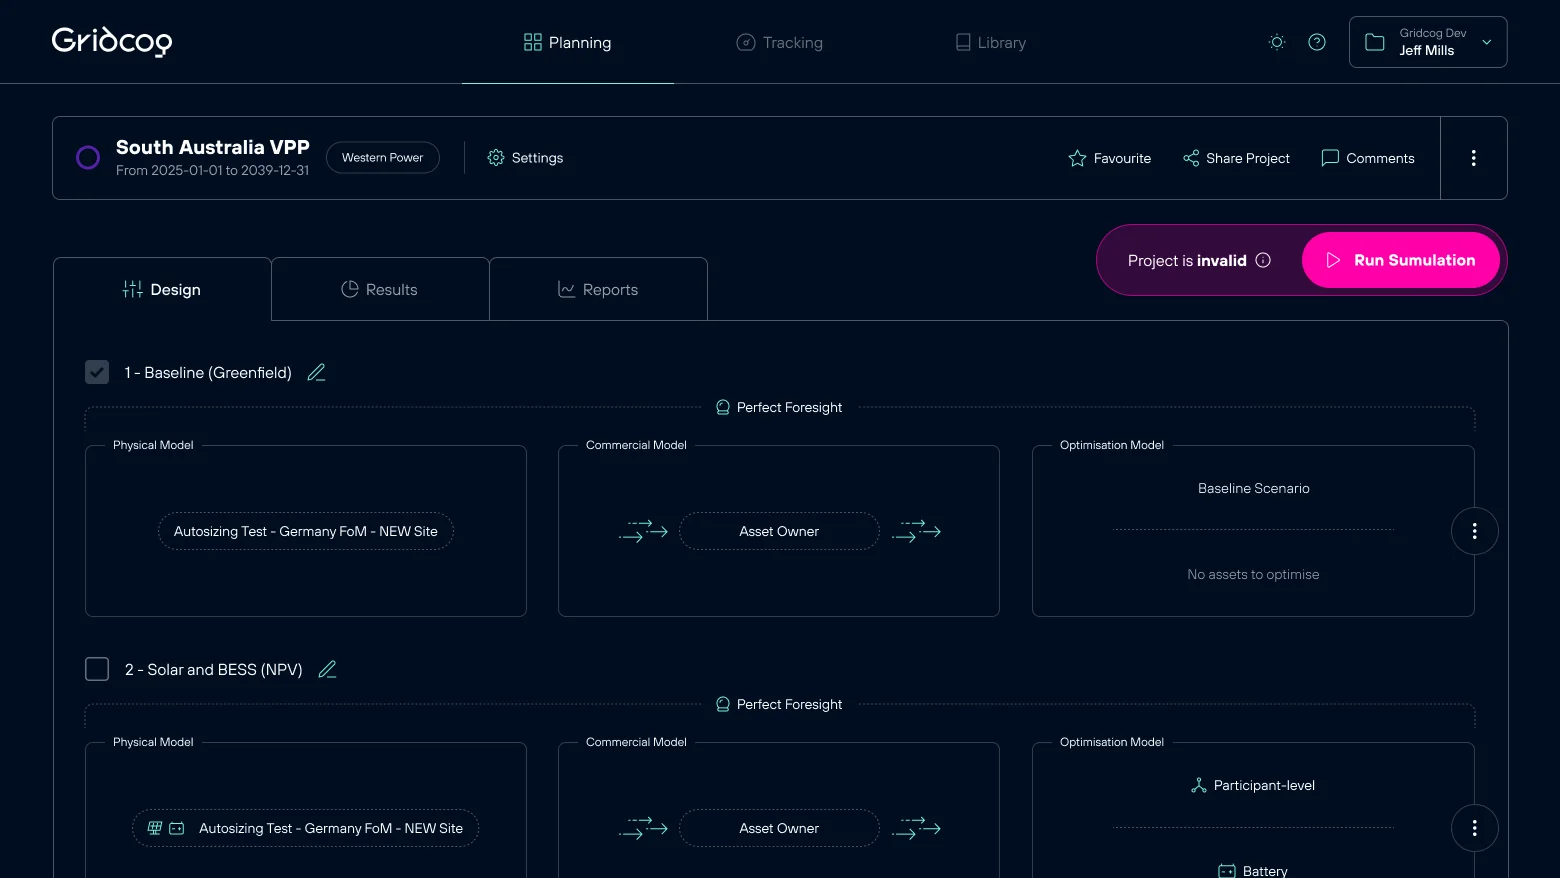
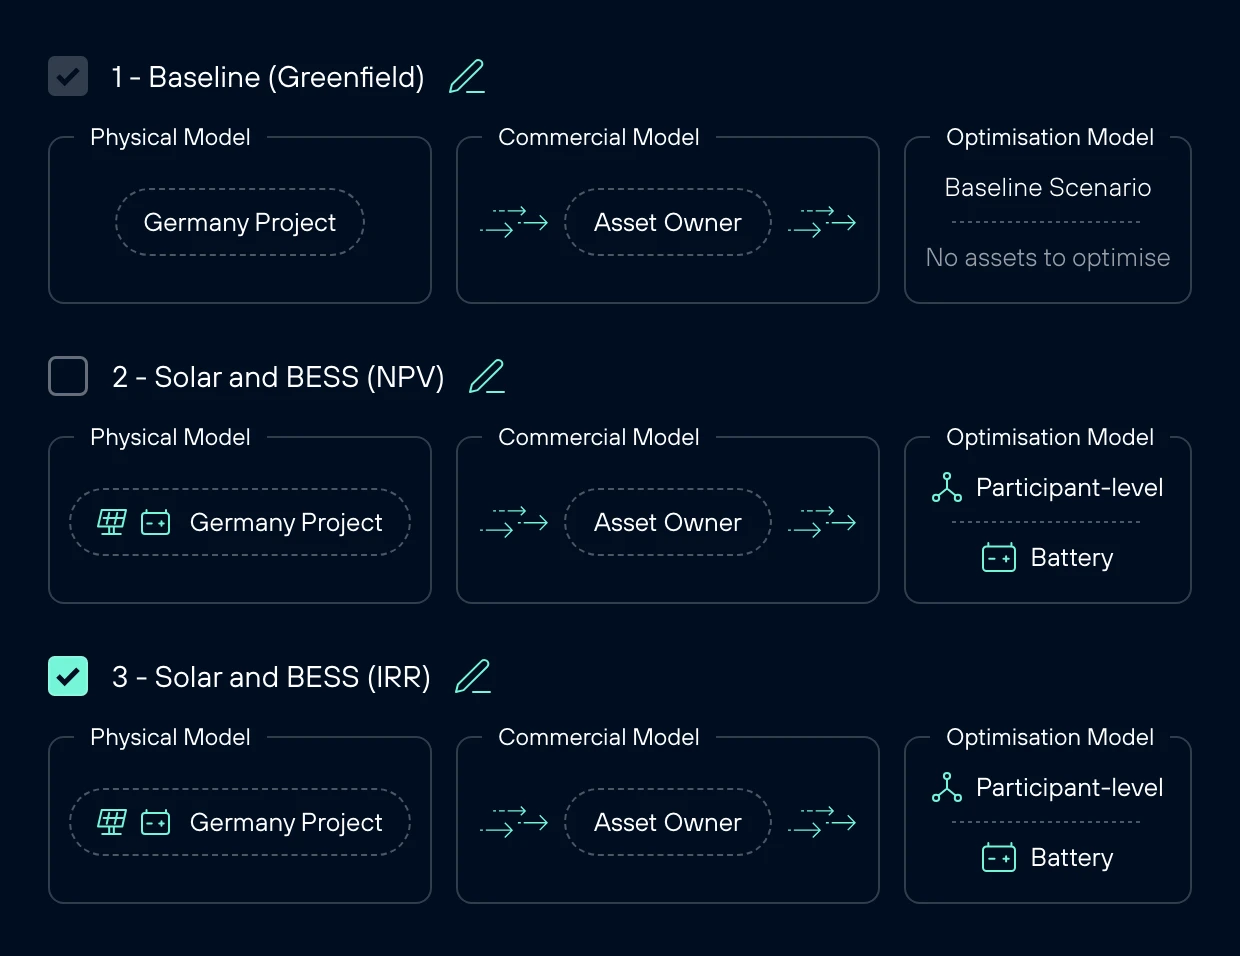
Every scenario is three models
A scenario is a row of three boxes: the physical model (what is on site), the commercial model (who pays whom) and the optimisation model (how it is run). Scenarios stack down the page, so a baseline sits directly above the options being tested against it.
- Instead of
- One long form for each project
- I chose
- Three models per scenario, stacked to compare
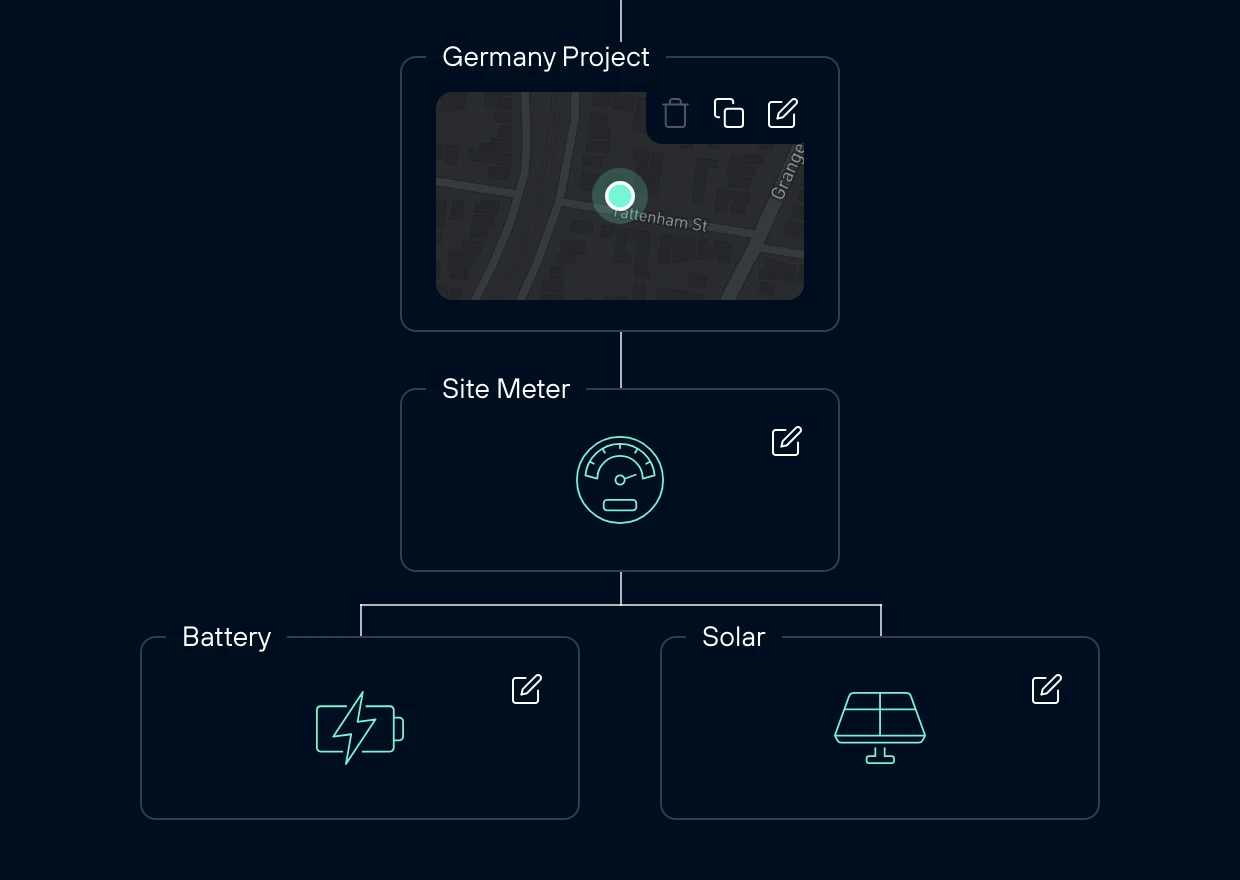
The site is drawn as it is wired
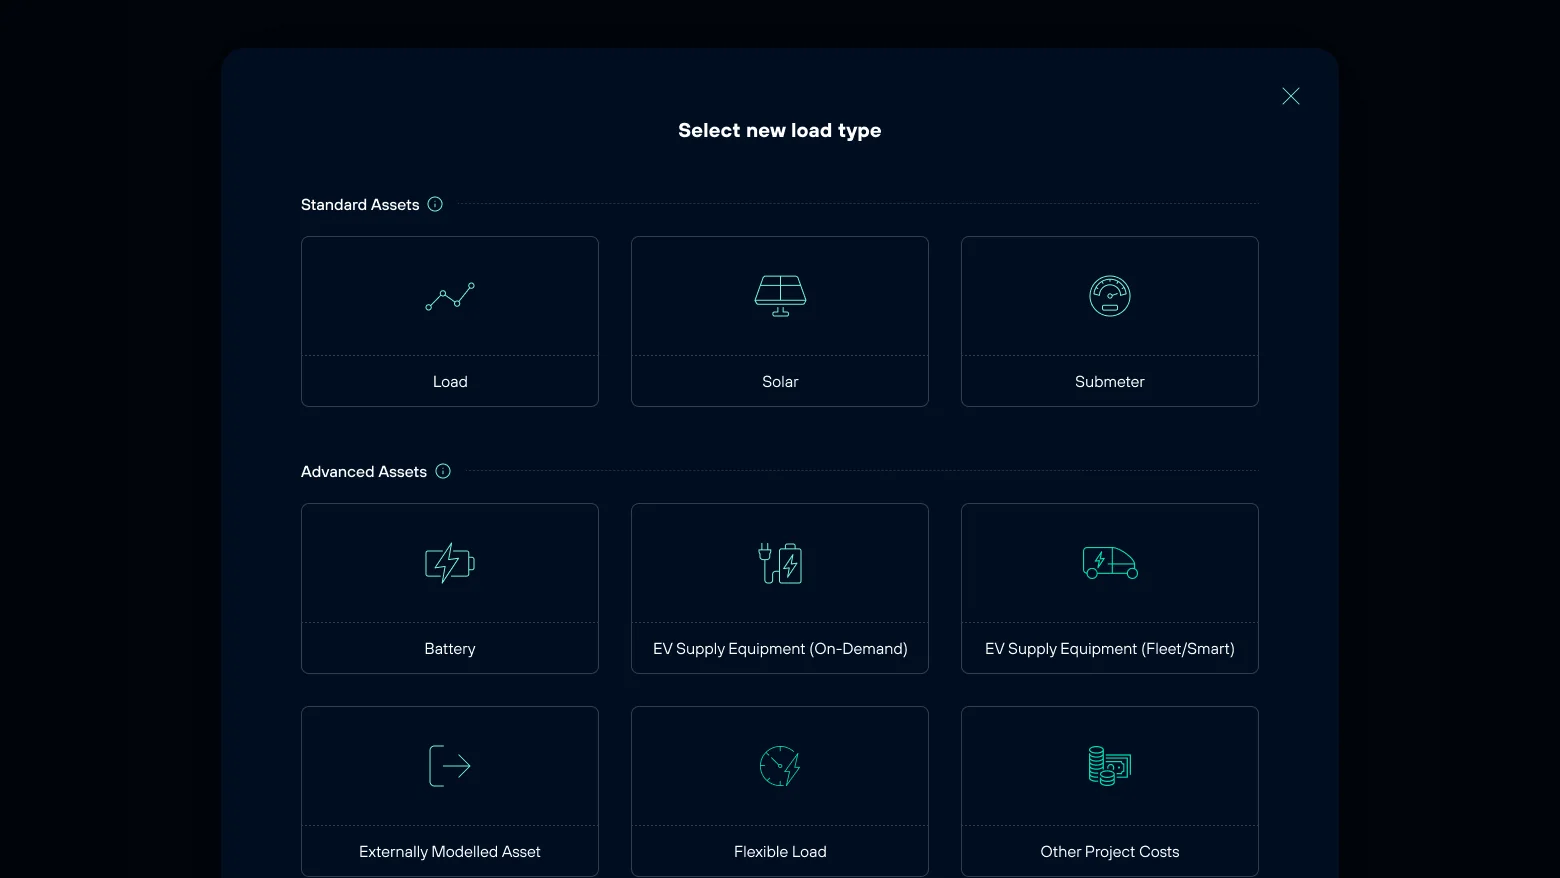
The physical model is a diagram: the site, its meter, and the battery and solar hanging off it. Adding an asset means choosing from a grid of types, from a simple load to a wind turbine. It reads the way an engineer would sketch it.
- Instead of
- A table of assets
- I chose
- A diagram of the connection
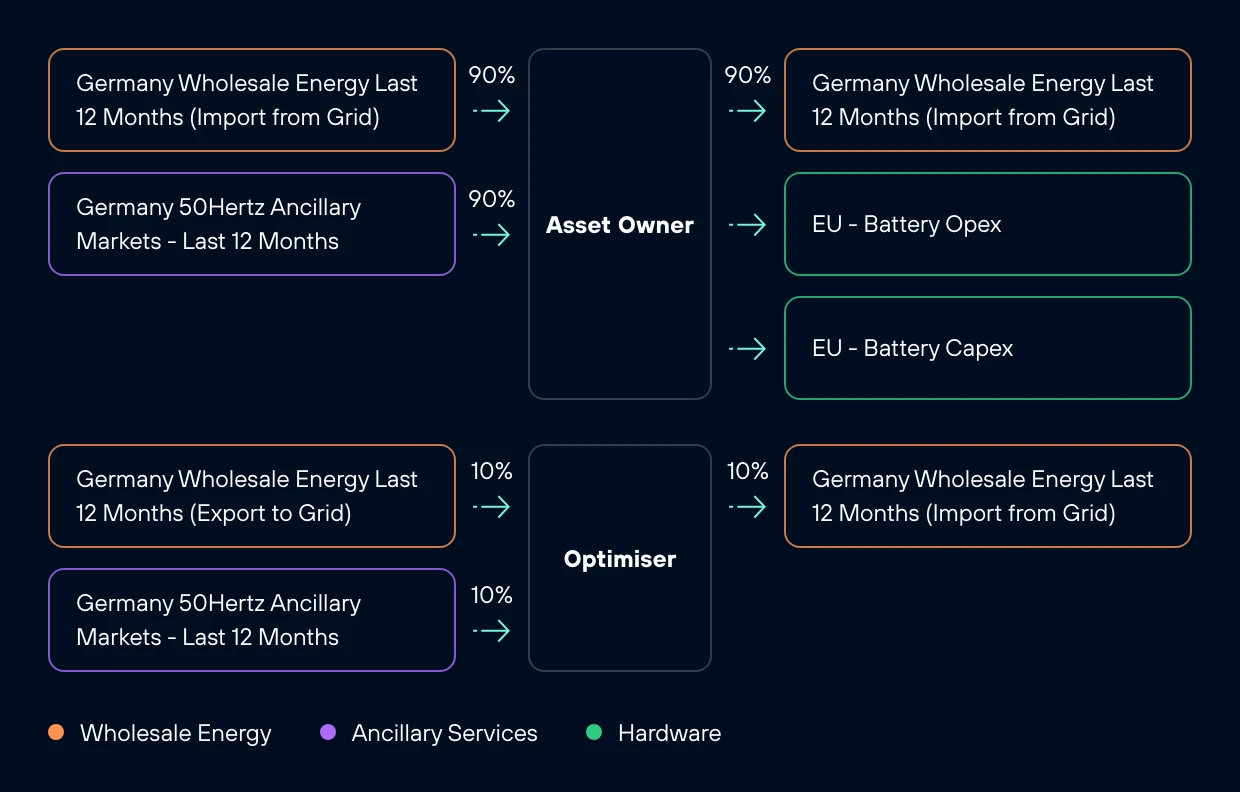
Money flows left to right
The commercial model shows each participant as a box, with income arriving on the left and costs leaving on the right. Splitting revenue between an asset owner and an optimiser is a percentage on the arrow. Colour separates wholesale energy, ancillary services and hardware.
- Instead of
- A form of contract terms
- I chose
- A flow you can read like a ledger
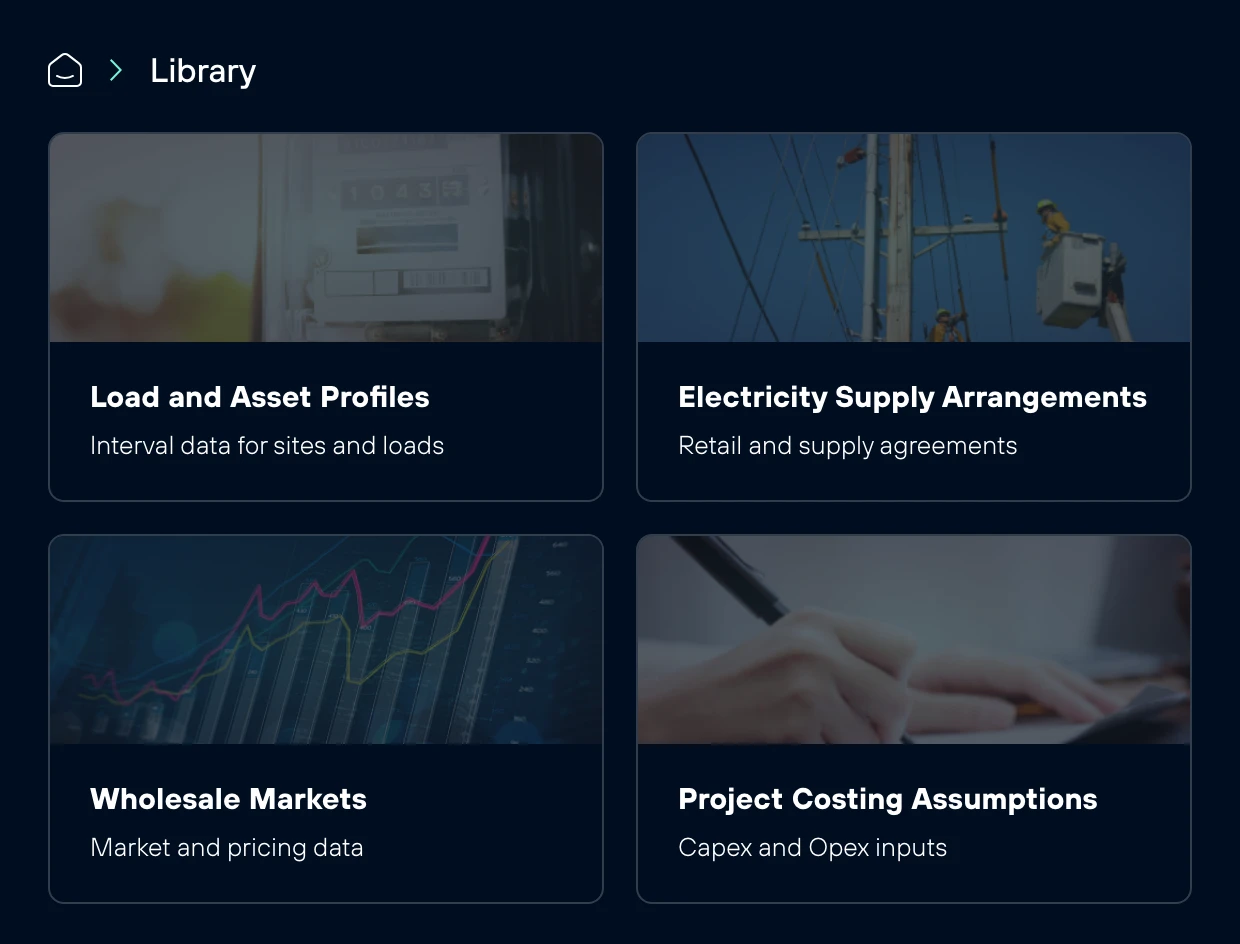
Assumptions live in a library
Tariffs, market prices, load profiles and cost assumptions are kept in a shared library and reused across projects. When a modeller changes one inside a project, the save button asks whether the change applies to this scenario only.
- Instead of
- Assumptions retyped in every project
- I chose
- One library, with local overrides
Help arrives inside the project
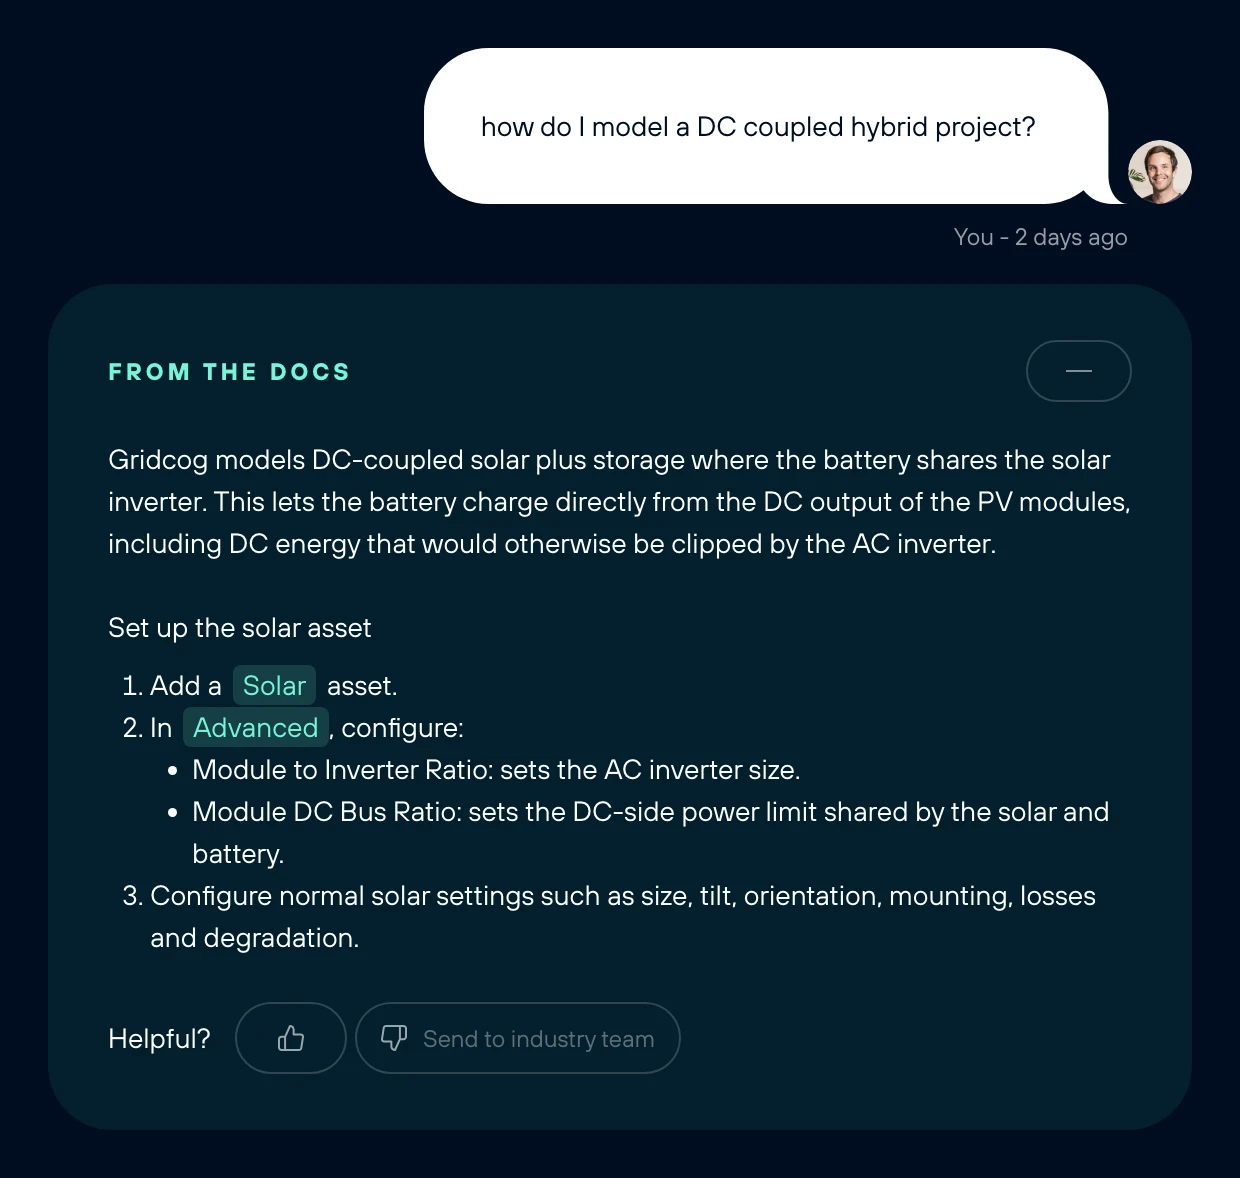
Each project has a chat panel for the team. Ask it a modelling question and the answer comes from Gridcog's documentation, as steps that name the exact settings to change. If the answer falls short, one click sends the question to Gridcog's industry team.
- Instead of
- A help centre in another tab
- I chose
- Answers in the project, from the docs


01 / 04
More of the product
Six more screens from the planning app and the library.
Using Gridcog has been 10x faster than in-house tools. We can iterate quickly, test multiple scenarios, and provide reliable financial results for investors.
Where Gridcog is now
Gridcog reports more than 18,000 projects modelled across 40-plus markets, with customers including Shell, TotalEnergies, Octopus Energy Generation, AGL and PwC. In July 2026 it raised a US$10 million Series A led by ABB.
Those results belong to Gridcog's whole team. My part is the interface their customers work in every day.
18,000+
Projects modelled on the platform, as reported by Gridcog.
40+ markets
Energy markets covered, as reported by Gridcog.
US$10m
Series A in July 2026, led by ABB.
Designing software for experts?
If your users know the domain better than anyone and still fight the tool, the structure is usually what needs redesigning. That is the work I do.